on some uses of speckle patterns in the assessment of synthetic apertures and quantitative vibration analysis*)
jean-charles viénot
university of basancon.faculté des sciences et des
techniques, france
introduction
the phase of the wave diffused, by a rough surface coherently illuminated is random. it results in the observation of the well-known speckle phenomenon the intensity distribution being directly related to the random structure of the surface. many workers, namely goldfischer /1/ and others /2,3/, have investigated the theory of the speckle and its statistical properties. a good deal of applications are described in the literature /e.g. refs.4...16/.
the purpose of the present paper is twofold: (i) using the diffused waves allows to vizualise the modulus of the optical transfer function of various synthetic apertures; (ii) choosing the contour of the illuminated region on the diffusing surface taken as the object leads to - in double exposure-interference phenomena the average intensity of which is nearly constant across a large area. from the results we have derived a particular approach to the study of vibrations. the speckle pattern techniques are fit to determine the vibration modes of any rough
surface of a mechanical structure but not the quantitative amplitudes. the latter is carried out by means of a suitable spatial filtering process applied to the speckle pattern. the technique gives the measure of rotation angles of surface elements close to the nodal regions.
visualization of the modulation transfer function of
synthetic apertures
be a plane diffusing surface (d), consisting of randomly distributed high-frequency scatterers of uniform average reflectivity (fig.1). for a constant illumination, the phase distribution, of the diffuser, d(x,y), is affected by the pupil function, p(x,y).
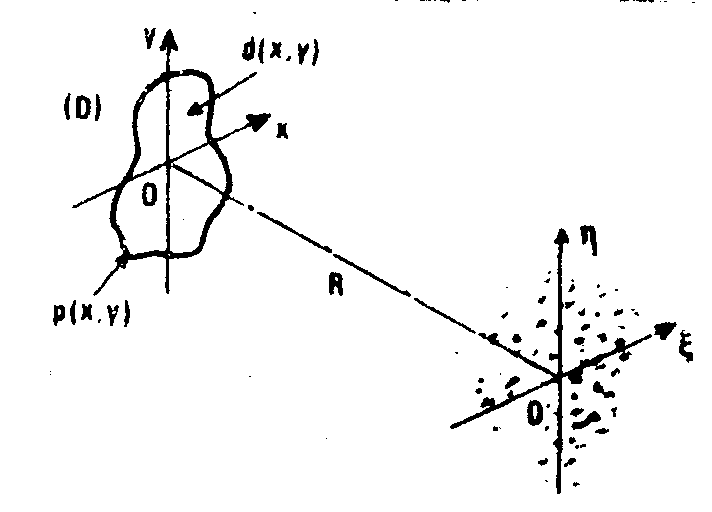
fig.1. schematic diagram for speckle pattern recording in a o'
ξη plane. the diffuser (d) of constant average reflectivity is defined by the phase distribution d(x,y) and contour function p(x,y).
in any observation plane, o'ξη, parallel with oxy, the scattered amplitude distribution is proportional to the fourier t
ransform of the compleze amplitude distribution. the energy di-
stribution, e(ξ,η
), is the square modulus of the amplitude.this energy is the sum of two terms, where the 2nd term represents the varying component of e, that is the fluctuations of the illumination about the average value e. the main steps of the calculation are sketched in the following.
energy in the speckle pattern: e(ξ,η) =
 (ξ,η)
+
 (ξ,η)
(ξ,η)
after goldfischer 
(ξ,η)* (ξ,η)
µ π{p(x,y)*p(x,y)}
if pupil function f(x,y) = p(x,y).d(x,y)
where p(x,y) = 1 inside the contour, 0 otherwise.
transparency of the negative of the speckle pattern:
t(ξ,η)
= a + b[e(ξ,η)], (a, b parameters).
spectral amplitude distribution:
t(ω,ν)
= π{t(ξ,η)} = a'δ(ω,ν) + bπ{e(ξ,η)},
intensity: i
(ω,ν)
= δ(ω,ν) +
bπ{ *
* }.
}.
then i(
ω,ν) µ
p(x,y)*p(x,y) apart from the central term
i(
ω,ν) µ
mtf of the aperture defined by p(x,y).
one notes that the intensity in the spectrum, i(
ω,ν), is proportional to the modulation transfer function (mtf) of the aperture, or the optical transfer function of an aberration-free imaging system of uniform transparency limited by the pupil p(x,y).
conversely the conclusion suggests a simple method to determine the mtf of a given pupil. the experience we had from the theoretical as well as experimental study of the mtf of various synthetic apertures carried out in our laboratory /5/ incited us to consider, as an example, a pupil in the shape of two bars perpendicular one to the other. this has been referred to as the mils cross aperture in current literature.
the experimental procedure consists of recording the speckle produced by a unlformely diffusing surface limited by the pupil under test, then observing the spectrum of the transparent negative obtained. its aspect stresses out the importance of the shape of the pupil on the statistical features of the speckle pattern (fig.2). figs.3 and 4 show photographs of the intensity

fig.2. the photograph of the speckle pattern (b) is a magnification of the intensity distribution obtained in plane o'
ηξ, as the diffusing surface at rest is illuminated by a coherent beam and the contour function p(x,y) a mills' cross aperture.
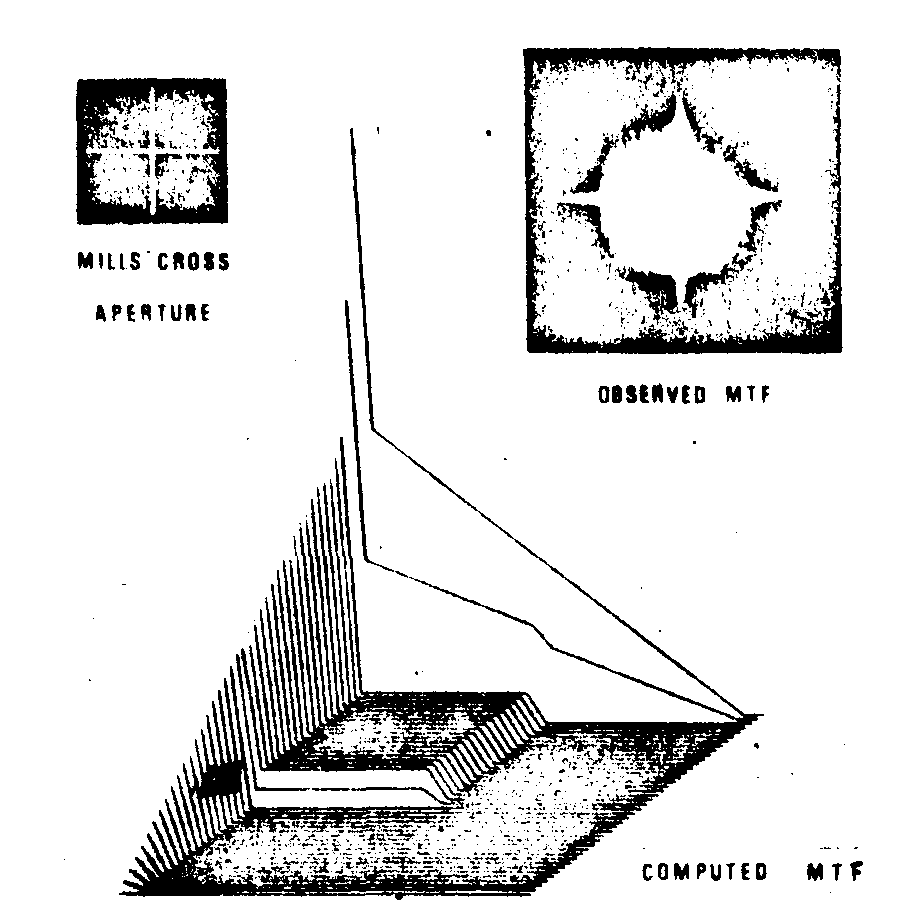
fig.3. top left: pupil under test; top right: intensity in the spectral plane of the speckle pattern recorded from a diffusing surface limited by that pupiltbottom: representation of the computed mtf (one quadrant).
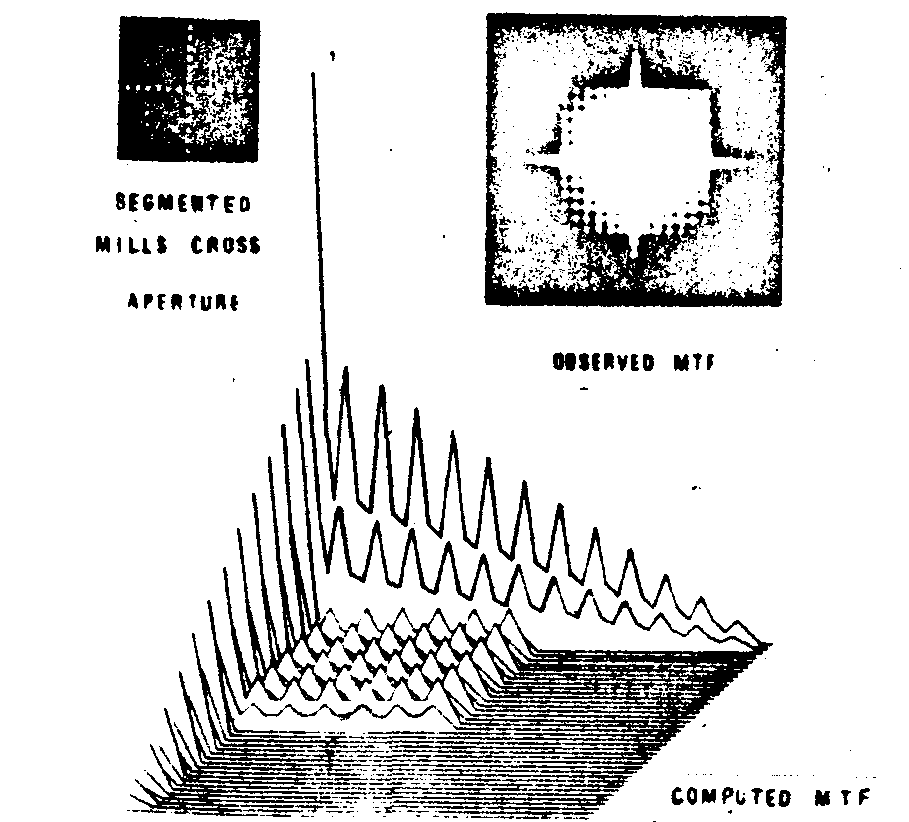
fig.4. as in fig.3 but the two bars of the cross nave been segmented.
distribution in the spectra of the speckle patterns, i.e.images of the mtf.
measurement of tilt angles
on a unique photographic plate let us record two or more speckle patterns corresponding to different positions of the diffusing surface. the situation is smaller to that encountered in double or multiple exposure holographic interferomatry. the resultant is tha superposition of identical speckles shifted in space and chronologically delayed. this holds if the surface displacements are small: such is the case with vibration studies aa tilt angles of elementary surfaces keep generally small. if m(
ξ,η) describes the displacement the new transparency is the convolution product of m by the amplitude transmittance defined before.
one finds again the term i(ξ,η) which represents the intensity in the fourier spectrum of the speckle pattern but modula
ted by a function which describes an interference phenomenon*) . the periodicity and profile of the fringes depend on the form of the function m(ξ,η). one might point out that these considerations led to the introduction several years ago /7/ of the fundamental concept of homologous_rays in holographic interferometry.
suppose now we want to measure the tilt angle of a moving surfiase very accurately from one exposure to the next. if it is is necessary that the fringe pattern be as little distributed as possible by the mtf of the pupil contour. therefore the best aperture is that whose auto-correlation function presents a uniform level across an extended field. this is obviously not the case with a circular aperture. fig.5 illustrates our statement.
in t
he case of sinusoidal vibration the function of position, m(ξ,η). can be calculated for a diffusing pupil oscillating sinusoidally (fig.6). fig.6(b) appears as the probability of presence of a given point q of the surface at position (ξ,0). it
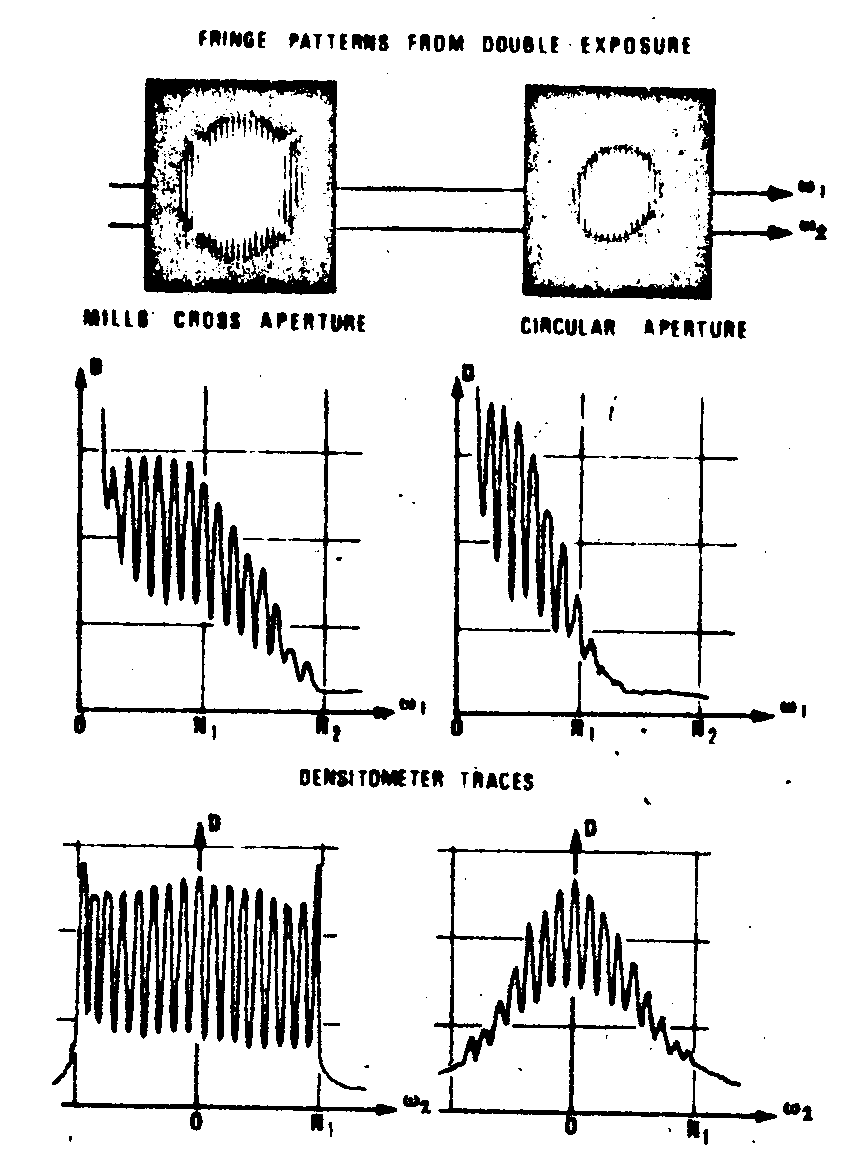
fig.5. fourier spectra obtained in the diffraction plane of a lens from the superposition of speckle patterns corresponding to two successive positions of the diffusing surface rotated by
α. if λ: wavelength, f: focal length, s: fringe spacing, r: separation between the diffusing surface and the plane where the speckle is recorded (cf fig.1), θ: incidence angle of the illuminated beam on that surface, α = λf/sr(1 + cosθ) as the recording direction is also or about. the interference fringes are observable inside an area directly related to the mtf range. the microdensitometer sections along axes passing through the center of the fringe patterns (ω1) and aside (ω2) show that the number of visible fringes is larger for a mills' cross aperture than for s circular pupil, although the maximum frequency n
2 is the same in both cases.
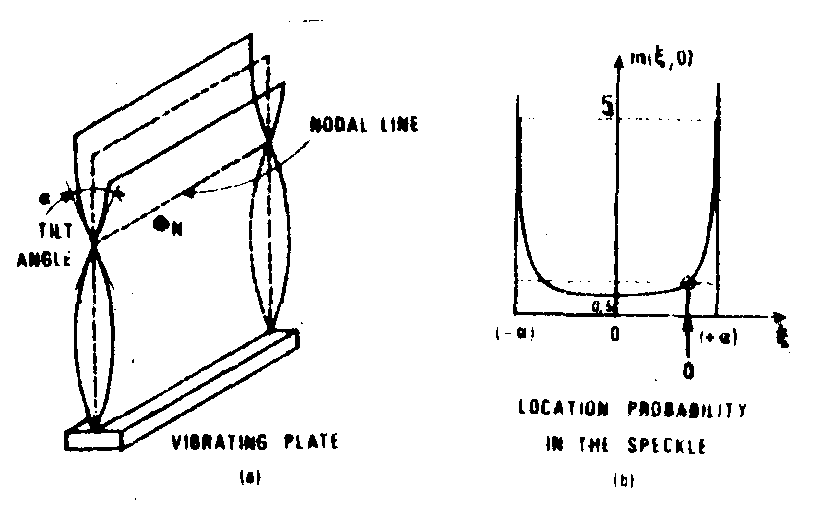
fig.6. example of a vibration mode of a metallic plate, is the tilt angle of diffusing elements such as Φn situated in the neighbourhood of the nodal line (a); the curve (b) represents the position function of these diffusing elements aa they oscillate (as well as that of the corresponding regione of the speckle).
comes to say that it indicates how long the speckle pattern occupies a given average location. the profile of the fringes resulting from the movement m is assessed by fourier transformation.
the theoretical and experimental curves are drawn in fig.7. as an illustration of this, the maximum tilt angle is 1,5*10-4 radian in the vicinity of a nodal line of a metallic plate (300 x 200 x 2 mm) vibrating at the frequency 430 hz (the diffusing region is a mills' cross the bars of which are 20 mm long). the resolving power of the conventional emulsion and camera aperture limits the range of measurement from 10-2 rad. to 10-7 rad.
determination of the vibration modes of a diffusing
mechanical structure
recording and useful properties of the time-average speckle pattern
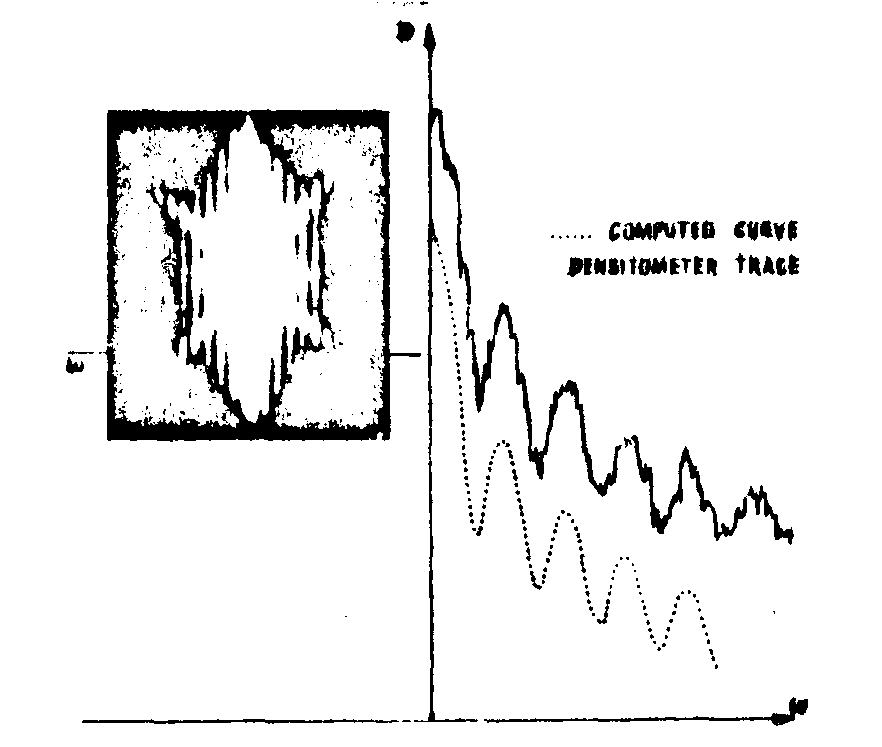
fig.7. photograph of the interference phenomenon obtained by fourier transform from a sinugoidal vibration of a rough plate (time-averaged speckle pattern). the microdensitometer trace (solid line) shows the variations of the optical density along ω axis, the dashed line is the oorreaponding computer curve (fourier transform of the curve represented in 6b).
whereas the time-average holographic teohniquee allow to determine the configuration of the vibration modes as well as their amplitudes at any point of the surface under text, the speckle pattern-technique usually appear as qualitative in the sence that they only provide an approach to the parameters which define the vibration modes.
in this section we intend to describe a method of recording and processing time-average speckle patterns consistent with the fundamentals derelopped so far and capable to provide quantitative information on the configuration and amplitude of the vi -
bration modes in various regions of the object (presently a 300 x 200 x: 2 mm metallic plate excited through acoustic coupling: a loud-speaker is used, vibrating at tunable frequency of a few hundred cycles/second). the method consists in a mapping of the vibration on the surface, the essential data being extracted from a photographic recording of the speckle pattern in a suitable spatial filtering operation. then one measures the tilt angles of the diffusing elements situated in the close vicinity of the nodal lines. an assessment of the maximum amplitudes is derived from the measurement.
three ways can be used in the recording of the patterns (i) following massey /6/, one takes a picture of the near-field speckle pattern due to the rough surface coherently illuminated, (ii) mottier /4/ puts a diffuser between the source and the object, the picture is now that of the speckle pattern due to the initial diffuser disturbed by the vibrating elements of the object, (iii) at the npl in england, tney record the interferogram observed by superposition of the speckle pattern upon a coherent background. we have employed the massey's technique as schematically represented in fig.8.
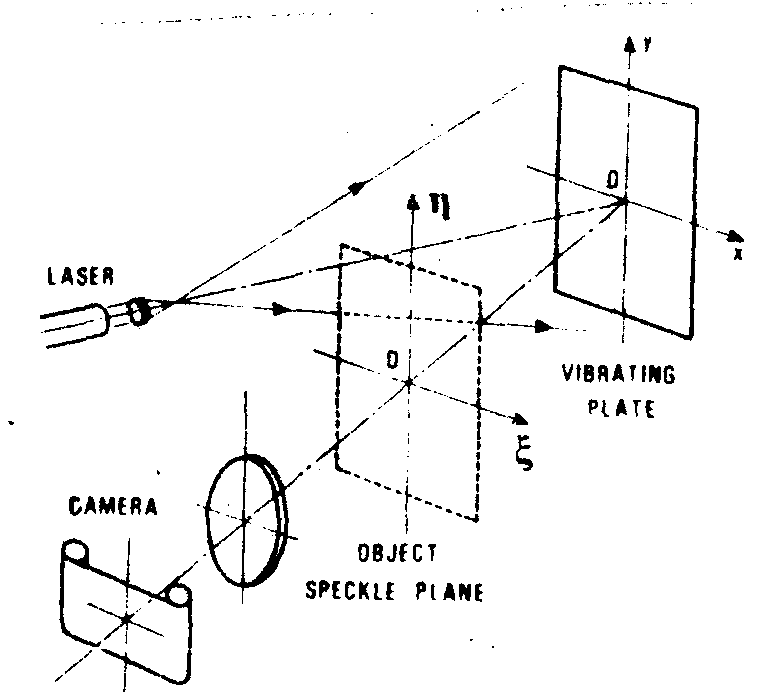
fig.8. principle of recording of the speckle pattern (maasey's method).
the major role of the geometry of the'setting is shown in fig.9: since the two points p and p' are conjugated by the ima-
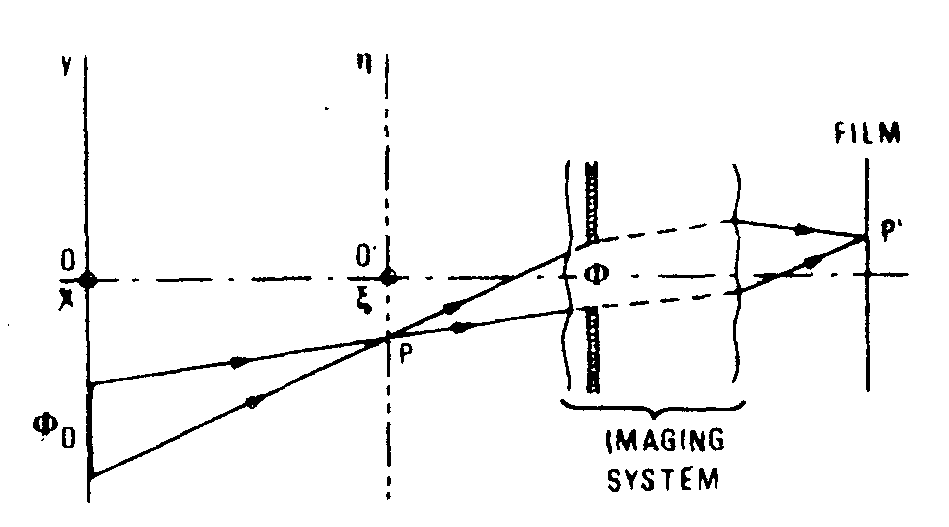
fig.9. geometry of the racording system.
Φd is an element of the diffusing surface corresponding to the point p' Image of the point p situated in the aerial speckle object plane, as the aperture size of the imaging system is.
ging system. the diffusing elemant of size Φ
d is responsible for the energy at p
' on the film. the Φd contribution to the speckle at p, therefore to the intensity at p'
depends on the nature of the movement of the element Φd. any rotation of d produces a lateral shift of the speckle around p, thus of p' on the film. this re
sults in a blurring effect, the importance of which is related to the tilt angle of the element Φd. for instance if the whole plate oscillates sinusoidally about an axis in its own plane without any deformation (fig.10a), all the elements Φd, rotate by the same angle and all points such as p' are stretched by the same quantity. on the other band if any deformation occurs, the various elements rotate by different angles varying from zero in the anti-nodal regions to a maximum in the nodal regions (fig.10b). in the diffraction sptetrum each direction of an eleaientary set of fringes is associated with one direction of the possible rotation axes. converisely the selecti-
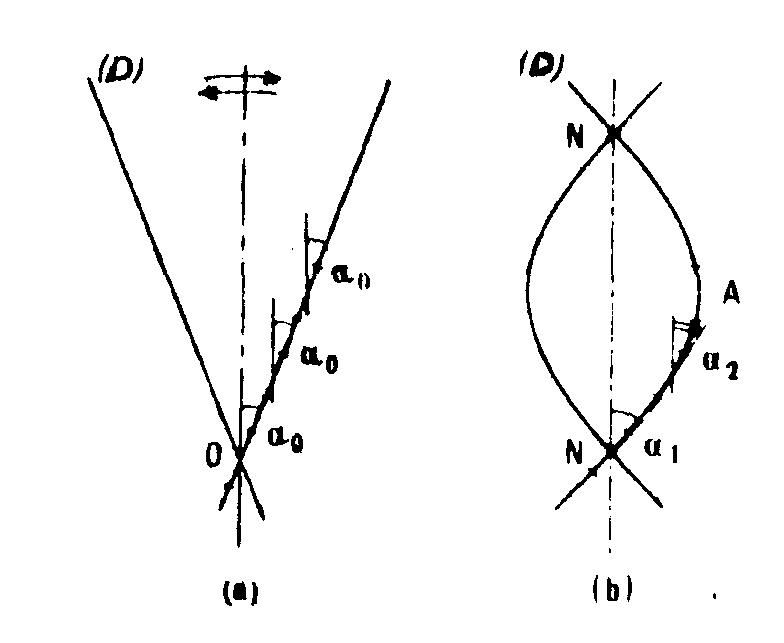
fig.10. influence of the deformation on the variation of the tilt angle: (a) oscillating plate, all the elements of the plate d rotate by the same angle α0; (b) vibrating plate, the angular displacement of the elements of the plate varies continuously from αmax in the nodal regions n to 0 in the antinodal region a.
on of a particular direction in the diffraction plane permits to reach a given set of diffusing elements, Φd, which have rotation axes parallel one with the other. practically this also suggests to use a spatial filter in vibration mode anaiysis dealing with speckle pattern.
extraction of the information by means of spatial filtering
the technique of isolating a given direction in the fourier spectrum is well known. the principle is recalled in fig.11. an orientable slit, s, is set in the fourier plane of the first lens, l1, of a double-diffraction setting; the mask, m, is intended to remove the low frequency terms, i.e. the background. a transparency of the speckle taken as the plate was vibrating is placed in the input plane of the system. the spatial filter
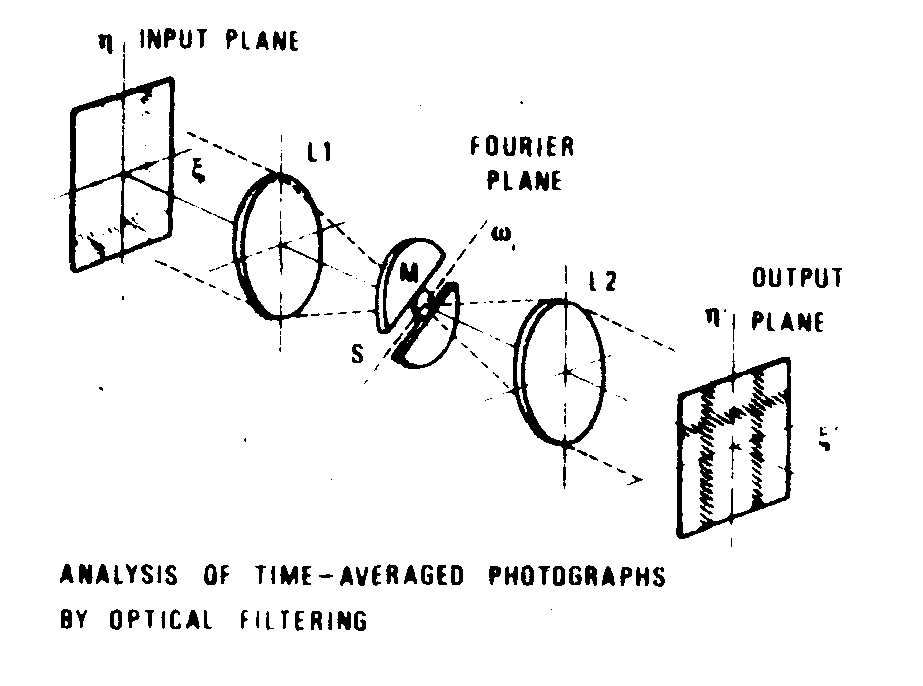
fig.11. schematic arrangement for analysis of time-averaged photographs by spatial filtering (double diffraction device). the narrow slit is placed in the fourier plane of the first lens; the locus of the elementary diffusing surface whose rotation axes are parallel with the direction of the slit ω1 is displayed in the output plane.
(s,m) only transmits the infonnation related to diffusing elements which have been affected by a rotation about axes parallel with the direction. reconstructed images as reported in fig.12 for three directions of the slit concern the modes of the previous plate vibrating at a frequency of 430 cycles/second. as expected three difarent configurations are observed. the three pictures at the top (a) have been obtained with a 1 mm-wide slit; in the center (b) with a the times thinner slit. however the spread function of the slit is not negligible. we thought it was better to observe streaks parallel with the rotation axes of the diffusing elements (fig.12c). this is performed by replacing the initial filtering slit by a small rectangular aperture whose longer dimension is perpendicular to (fig.13). finally assuming an annular aperture is equivalent to
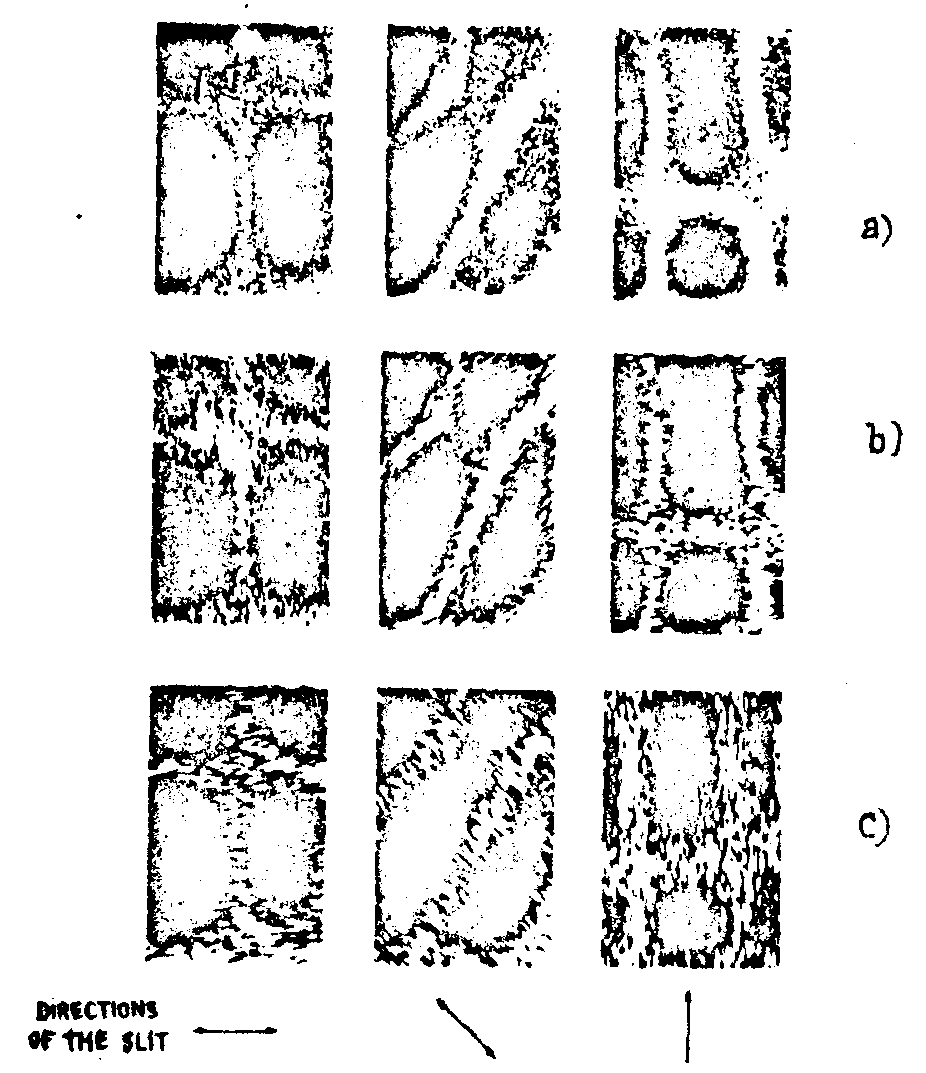
fig.12. results obtained by filtering process.the directions of the orientable slit are represented below each column. in (a) width of the slit is 1 mm tnen 0,1 mm in (b); the pictures (c) are obtained by replacing the slit by a rectangular aperture of small size, oriented perpendicular to the studied direction at some distance from the center of the diffraction pattern (see fig.13).
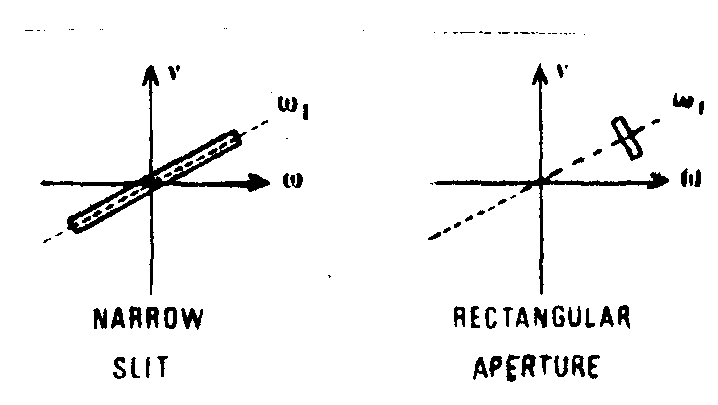
fig.13. explanation in caption fig.12.
an infinite number of email rectangular apertures aet perpendicularly to the radii, a pupil in the form of a ring used as a filter enables to visualise eviry direction of rotation axes corresponding to any diffusing element simultaneously. fig.14 illustrates the use of a ring filter. it shows an anti-nodal region in the center with four saddle around. the determination of the tilt angles as explained in a previous section completes the quantitative aspect of the method.
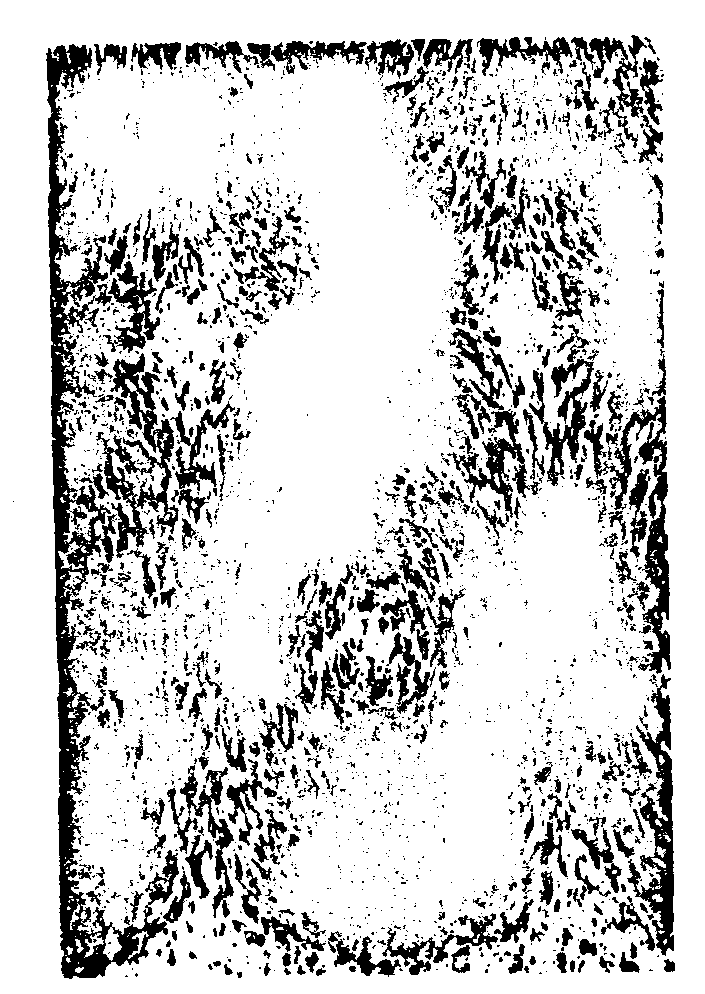
fig.14. Image obtained as the filtering aperture is a ring placed in the fourier plane of the correlator: the directions of the rotation axes of all elements Φd are ainiultineously otrervabie.
c o n c l u s i o n
some prevailing points can be stressed: (i) the statistical properties of the speckle pattern yields to the direct visualization of the optical transfer function of any given pupil: the intensity distribution in the diffraction pattern of the speckle is proportional to the auto-correlation function of the pupil contour limiting the diffusing surface. actual examples have been presented; (ii) a further application was given in the study of the rotation of diffusing pupils, the tilt angles being determined from double exposure photographic recording. hence, in the case of vibrating mechanical structures the amplitude of the displacement is assessed by means of time-averaged recording: (iii) quantitative description of the vibration modes can be achieved by spatial filters matching the deformation of the granular structures during the displacement of the diffusing elements. the experimental conditions are not so severe as those demanded in holography, the only requirement being some reliable, filtering process.
r e f e r e n c e s
1. l.i.goldfischer. j.opt.soc.am., 55, pp.247-253, march 1965.
2. h.h.hopkins and h.tiziani. proc.of the int.symp.on the appl. of holography, ed.by j.oh.viénot &al., beasncon, 1970.
3. s.lowenthal, h.arsenault, d.joyeux. proc.of the int.symp. on the appl. of holography, ed.by j.ch.viénot &al, besancon, 1970.
4. b.eliasson and f.m.mottier. j.opt.soc.am., 61, p.559, 1971.
5. a.caron. these de 3éme cycle. pupiles synthetiques en lumiere spatialement incoherente, correction des images au moyen de fonctions particulieres.
6. g.a.massey. nat.technical information service, springfield, va.22151, study of vibration measurement by laser methods, nasa rept. n° 68-14070, 1968.
7. j.ch.viénot, c.froehly, j.monneret and j.pasteur.proc.of the symposium on the engineering uses of holography, glasgow, 1968, ed. by e.b.robertson & al, cambridge university press, 1970.
8. c.prochly, j.monneret, j.pasteur and j.ch.viénot. symposiun on application of coherent light, florence, sept. 1968 and optica acta, 16, n° 3, p.34-362, 1969.
9. j.monnret. thèse de doctoral d'etat, 1973.
10. e.archbold, j.m.burch, a.e.ennos and p.a.taylor. nature, 222, p.263, 1969.
11. j.n.butters and j.a.leendertz. optics and laser technology, 3, p.26, feb. 1971.
12. l.ek, n.e.molin. opt.comm., . 2, p.9, 1971.
13. k.fernelius, c.tome. j.appl.phys. 2, p.2252, 1970.
14. j.a.leendertz, j.sc.instruments, 3, 214, 1970 and proc. of the conference ico on optical instnumerts and techniques, ed. by j.m.dickson, oriel press, p.256, reading 1969.
15. s.debrus, m.francon and m.may. proc.of the conference ico on optical instruments and techniques, ed. by j.m.dickson, oriel press, p.318, reading 1969.
16. e.archbold, a.e.ennos. optica acta, 19, n° 4, pp.253-271, 1972.
17. h.j.tiziani. optica acta, 18, pp.891-902, 1971.
18. m.e.guillaume. these de 3éme cycle, contribution à l'étude d'une onde cohéerente diffusée et a la determination optique dee modes devibration de systèmes mecaniques, besancon, 1972.

