embossed holoqraphic movies
w.j.hannan
rga laboratories. princeton, n.j.
u.s.a.
the holotape® syatem described here was developed at rca laboratories, princeton, n.j. aaiong the members of the technical staff who made significant contributtons to the development of this system are:
r.a.bartolini, w.e.barnetter, j.bordogna, c.b.carroll, h.r.demers, n.feldstein, a.h.firester, j.t. fischer, r.e.flory, e.c.fox, j.r.frattarola, t.e.gayeski, h.g.gerritsen, w.g.gibson, d.l.greenaway, c.s.ih, e.james, d.karlsons, r.d.kell, e.luedicke, m.lurie, c.h.morris, e.g.ramberg, j.p.russell, r.j.ryan, h.g.scheible, f.w.spong, r.e.werner, and j.a.zenel.
i. introduction
one of the next evolutionary steps envisioned in education and home entertainment is a cartridge that will play both sound and motion pictures, utilizing the tv receiver that is presently in nearly evryone's home. just as the phonograph record brought prerecorded sound to radio, the tv cartridge will bring prerecorded video to television, letting the viewer "see what he wants to see when he wants to see it".
holotape is one of the candidates for the prerecorded video market. as implied by its name. holotape is a tape on which televinion pictures are stored in the form of embossed holograms. basically, the manufacture of holotape amounts to embos-
sing pictures as well as sound information on vinyl, the same type material used for photograph records. the prime reason for adopting this approach is the exceptionally low manufacturing cost of embossed tapes.
this report summarizes the main technical decisions which led to the development of the holotape system. in particular, it attempts to answer these questions: why holograms? why fraunhofer holograms? what signal-to-noise ratio can be achieved from images reconstructed from very email holograms? what are the sources of noise and how can they be suppressed? how can color pictures be recorded? and, how holotapes be replicated?
a. relief pattern recording and playback systems
1.carrier frequency system
there are many ways to encode pictorial information so that it can be stored as relief patterns and thus be replicated by an embossing process. in fact, storing pictures in the form of modulated grating patterns suitable for embossing was reported as early as 1906 /1/. at that time the modulated grating patterns were called "diffraction chromoscopes", mors recently they have been called "carrier frequency photographs" /2/. a system uitilizing embossed carrier frequency images is illustrated in fig.1. the tape shown has 1.8x2.7 mm carrier frequency images
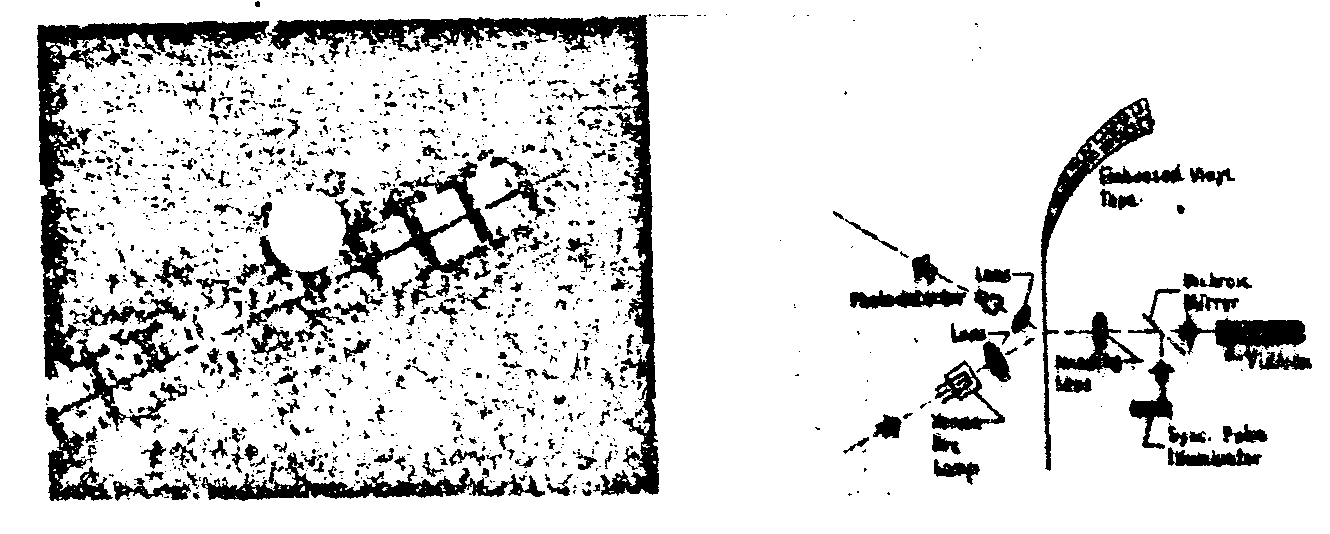
fig.1. embossed carrier frequency movie system (embossed movie player).
embossed on its surface. next to each Image is a sync mark which is utilized during playback to trigger a strobe lamp. this allows the tapes to be read out with a continuous motion tape transport, the duration of the strobe pulse being short enough to "freeze" the Image on the target of a tv camera tube.
although this type system has the low cost advantage of embossed tapes and it requires only incoherent light for playback, it suffers from all the defects that plague small frame movies; namely, poor dirt and scratch resistance, Image wobble, and complicated player mechanisms. therefore, it is not too attractive for movie systems. a potential application is in systems that require direct projection of color images from low cost tape. this can be accomplished /3/ by utilizing three angularly displaced carriers, one for each primary color, and fourier transform plane filtering to direct the appropriate color light into the reconstructed Image.
2. fraunhofer holographic system
the advent of holography coupled with the development of lasers has led to a new method for picture encoding which offers these advantages:
low cost replication - relief phase holograms can be embossed on low cost vinyl tape.
scratch and dirt resistance - highly redundant holograms can be scratched, obscured by dirt and otherwise mutilated without serious Image degradation.
Image immobilization - fraunhofer holograms produce stationary images even though the holograms are continuously moving through the readout beam. flicker-free images can be produced at any tape speed with no need for servo control between tape speed and tv scan rate, intermittent tape transport or moving shutters. unlike all other prerecorded video systems, holotape is completely compatible with any forein tv standard, and can be played in fast, slow, or stop
motion.
reliability - there are no high speed moving parts in a holotape player, and optical alignment is not critical. achieving these advantages calls for the use of redundant holograms, a laser for both recording and playback, and an imaging lens in the player. (the need for a laser could be avoided by using in-focus or Image-plane holograms /4/, but such holograms are identical to the carrier frequency photographs just described and therefore they suffer from the same problems).
the simplicity of the holotape player is apparent from fig.2. it consistes of a laser, a tape transport and a tv camera, the output of which goes to an ordinary tv receiver. clear vinyl tape with images stored in the torn of embossed holograms moves continuously through the laser beam, projecting a motion picture sequence of images into the tv camera.
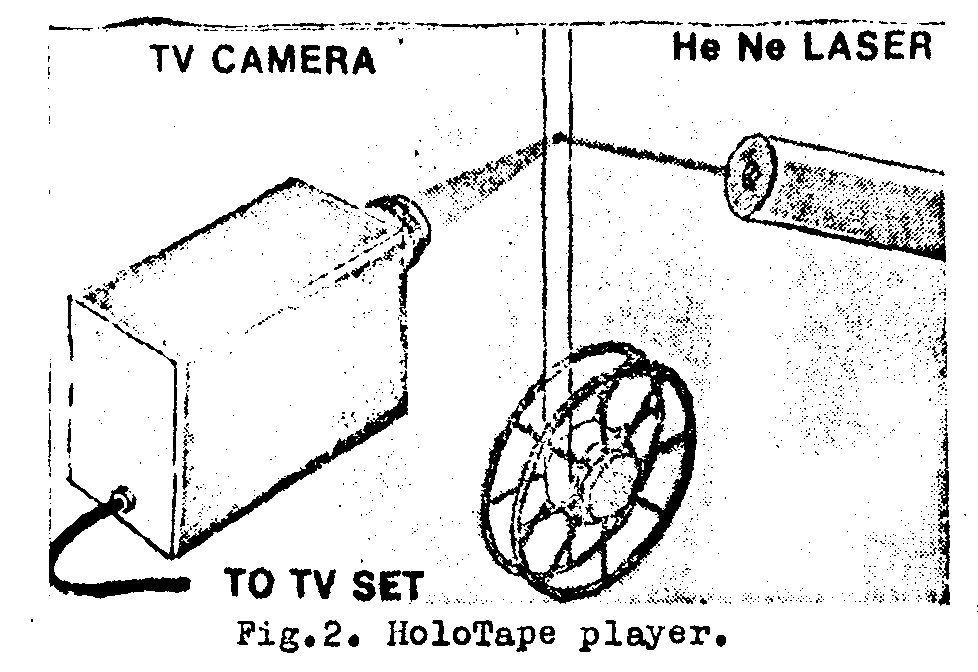
fig.2. holotape player.
b. holotape manufacturing process
photos of laboratory equipment presently used to make experimental holotapes are shown in fig.3. the hologram recording material, a positive photoresist (shipley az-1350), is costed on cronar (fig.3a), a high-quality substrate material produced by dupont. color encoded black-and-white movies, recor-
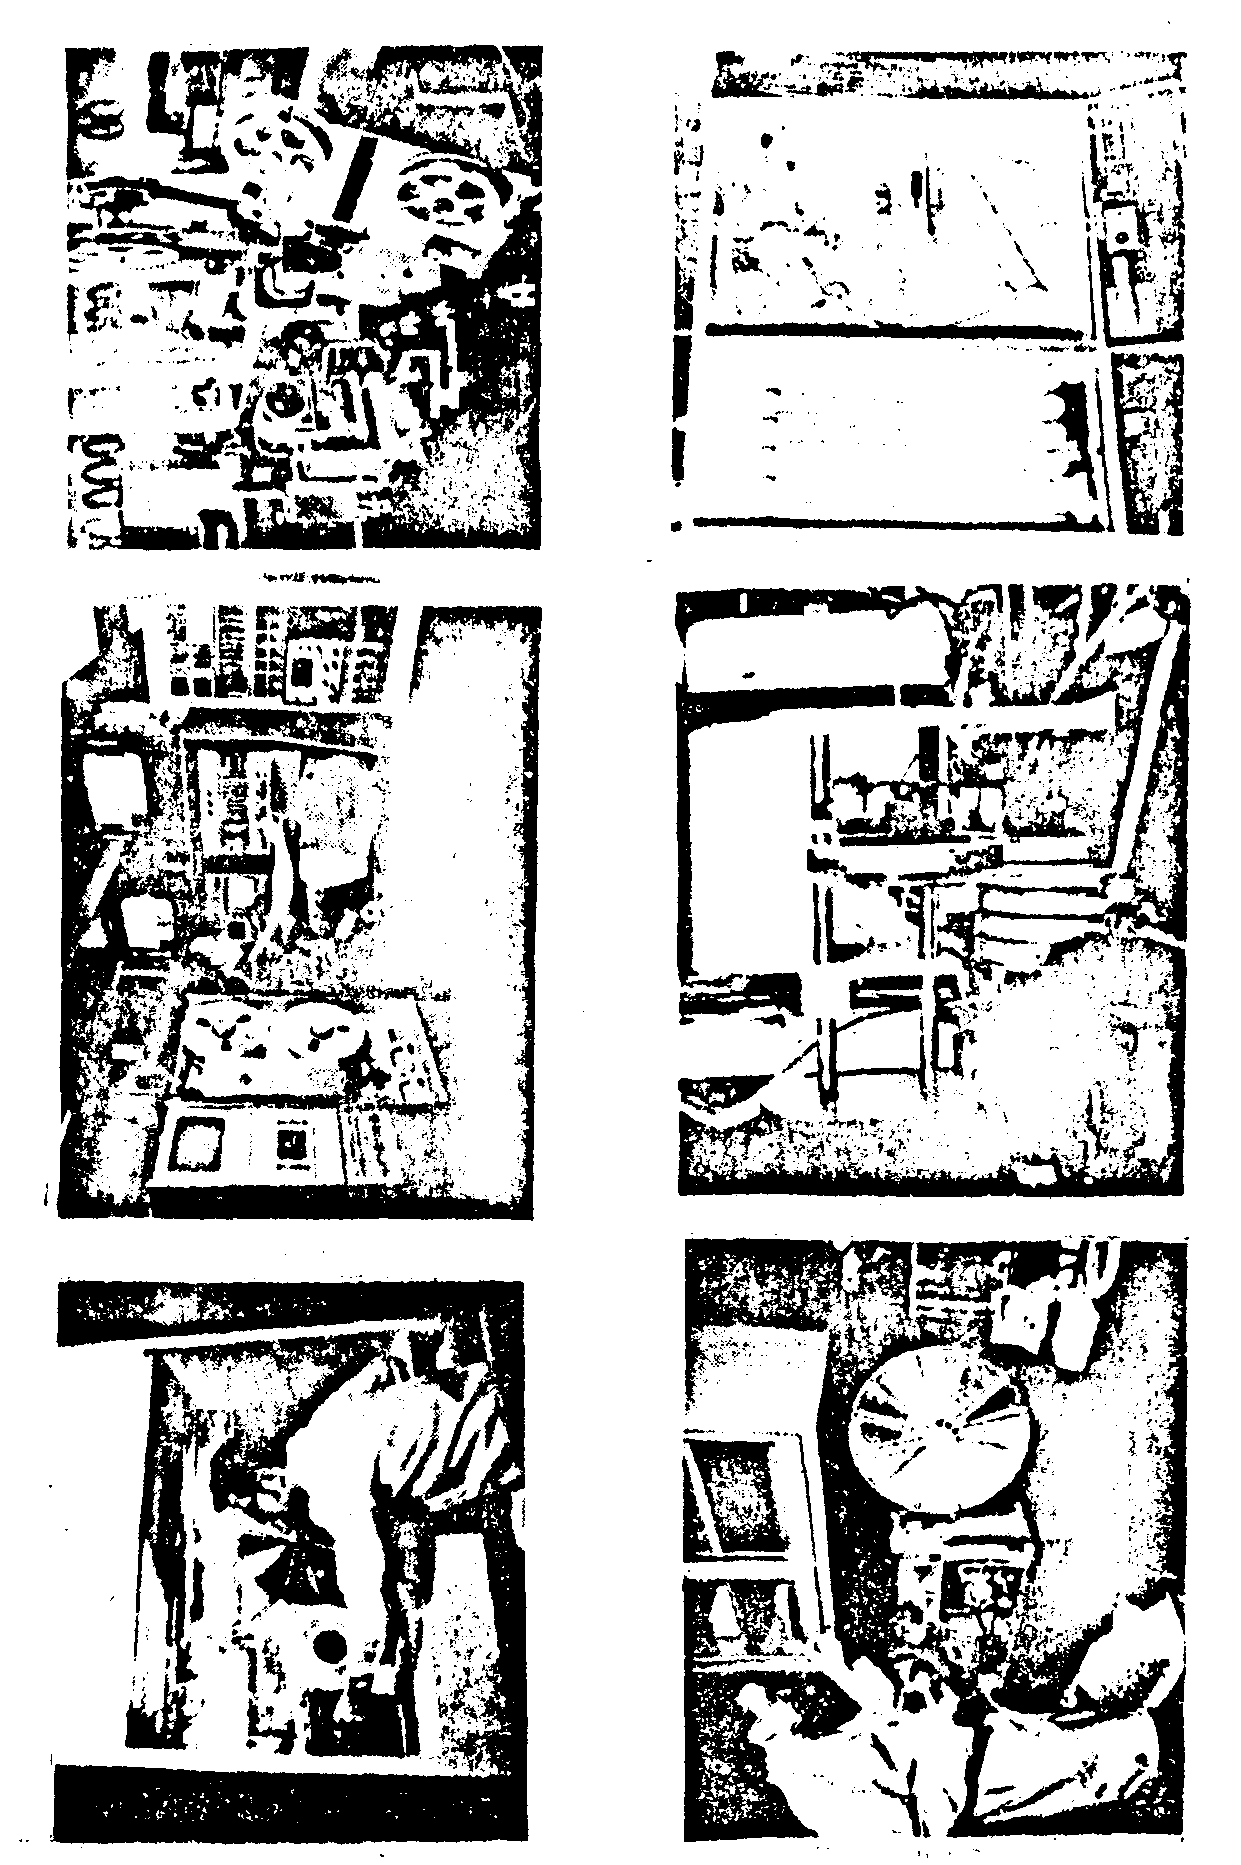
ded by means of au electron beam recorder (fig.3b), serve as the object transparencies from which the holograms are recorded. (color encoding methods are described in section v-c of this report). the holographic recording system (fig.3c) includes a hecd laser, photoresist tape and object film trade ports, the usual beam expanders, pinholes, mirrors and beam splitters, and a apecial optical component (discussed later in section "redundancy") which enables highly redundant holograms to be recorded. the recording system functions automatically recording a sequence of holograms on photoresist tape, each hologram corresponding to a frame of the color encoded movie. after exposure, the photoresist-coated tape is passed through a developing machine (fig.3d) in which the areas exposed to more intense light are etched away, leaving the surface corrugations which form the phase holograms. an electro-forming process (fig.3e), similar to the one used to make nickel masters for phonograph records, is used to produce a nickel master tape from the original photoresist tape. typical thickness of a nickel master tape is about 2 mils. finally, vinyl replica tapes are embossed (fig.3f) by sandwiching the nickel master tape and raw vinyl tape between two moving rollers.
ii. relief - phase hologram
a. basic theory
as noted at the end of the preceding section, the end result of the holotape manufacturing process is a motion picture sequence of "phase" holograms in the form of surface relief patterns on vinyl tape. the fundamental properties of phase holograms can be derived from tho simple recording geometry ahown in fig.4. if both the object and reference bewis are plane waves, the complex field, amplitude of the light incident on the recording medium is
u=a0+arexp[i
ωxx] (1)
where  is the spatial frequency
of the hologram fringes and a0 and ar are the complex
field amplitudes of the object and reference beams, respectively. it follows
that the intensity is
|u|2=a0a0*+ar2+a0*arexp[iωxx]+a0ar*exp[-iωxx]. (2)
in this simple example a0a0*=a02 because the object beam is a plane wave; therefore eq.(2) can be expressed as
|u|2=a02+ar2+2a0arcosωxx. (3)
note, however, that this represents a very special case. in the case of a complicated object a0a0* is neither real nor constant and it has frequency components extending to twice the frequency spectrum of the object along. the importance of this fact will be discussed later.
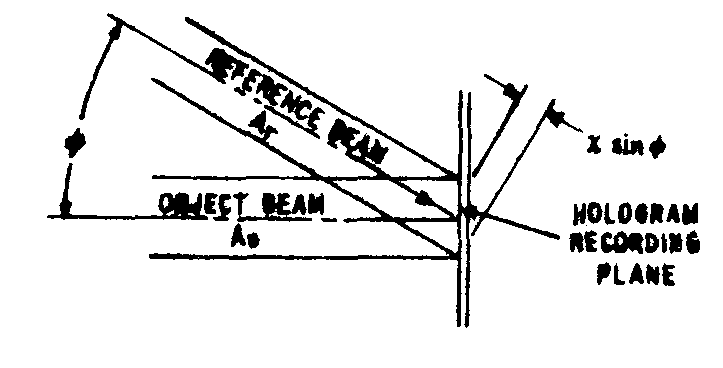
fig.4. recording geometry.
now, with regard to surface relief holograms, assume a recording medium which undergoes a change in thickness which is diwstly proportional to exposure:
Δ
l=g|u|2t (4)
=g[a02+ar2+2a0ar
cosωxx]t (5)
where g is the (change in thickness)/(exposure) constant of the material and t is exposure time. accordingly, hologram transmittance is
th=exp[i(n-1)kΔlcosφ] (6)
where
n is the refractive index of the recording (or replicating) material and k=2π/λ.
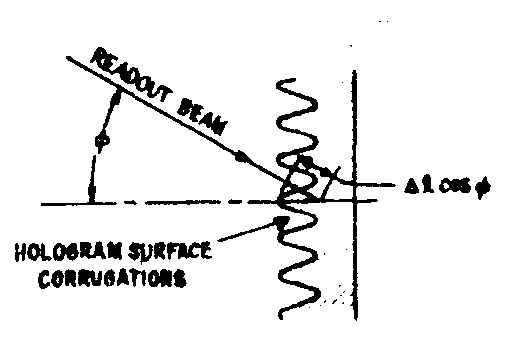
when read out by a reference beam ai
exp[iωxx], as illustrated in fig.5, the complex field amplitude of the light diffracted by the hologram is
s=arexp[iωxx]exp[i(n-1)kΔlcosφ]. (7) fig. 5 .readout geometry.
substituting (5) in (7) we get
s(x)=arexp[iθ]exp[iωxx]exp[i2(n-1)kgta0arcosωxxcosφ] (8)
where θ=kgt(n-1)(a
02+a
r2)cosφ. eq.(8) can be expanded as a fourier seriest
 (9)
(9)
where
 (10)
(10)
 (11)
(11)
to get this expression into a more recognizable form, let y=ω
xx;
β=2(n-1)kgta0ar cosφ, andar'eiθ=d; then
 (12)
(12)
recognizing that
 (13)
(13)
where jm
(β) is a bessel function of the first kind and order m , allows the fourier components to be expressed as
cm=dj(1-m)
(β). (14)
thus, the complex field amplitude of the light diffracted by this particular hologram, which is actually a simple phase grating, is given by
 (15)
(15)
indicating that the complex field amplitude of the reconstructed object is proportional to j1
(β) as shown in fig.6.
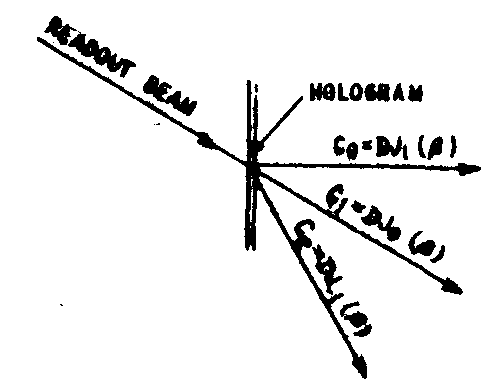
fig.6. reconstructed beams.
b. efficiency of phase hologram.
efficiency of a hologram is defined as the percent of incident light flux that is diffracted into the first order beam. accordingly, from (14) the efficiency of a phase hologram is
η=|j
1(β)|2. (16)
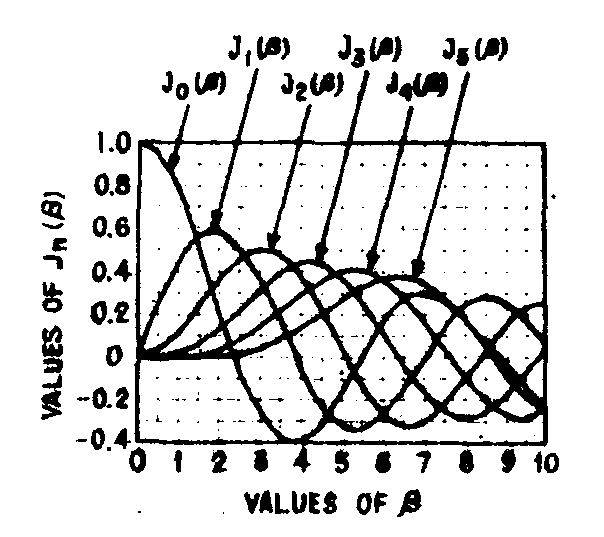
now, as shown in fig.7, the maximum value of j1(β) is 0.581, corresponding to βmax=1,839 radians; therefore, maximum efficiency is nmax= (0,581)2 = 0,34 or 0,34 or 34%. since the phase shift caused by surface corrugation Δl is
 (17)
(17)
achieving maximum efficiency calls for a peak corrugation amplitude of
 (18)
(18)
 or a peak-to-pealt amplitude
of about one wavelength.
a similar analysis reveals that the maximum efficiency of a conventional amplitude hologram is only 6,25%, which is considerably lower than the 34% efficiency limit of a phase hologram. however, it is not correct to conclude that phase holograms are inherently more efficient than amplitude holograms. urbach and meier /5/ calculate that for a 5% deviation from linearity, the maximum diffraction efficiency of a phase hologram is 9%. corresponding to a phase modulation of a
β=0,6 radian. cathy /6/ suggests a limit of β=0,2 radian to suppress nonlinear effects; this would limit efficiency to 1%. bartolini, et al /7/ find that exposure parameters required to produce no objectionable nonlinear effects for a wide range of subjects, as encountered in a motion picture sequence, results in an average
efficiency of about 3%, this corresponds to β=
0,4 radians or 0,06 wavelengths and requires a peak-to-valley depth in the relief pattern of 0,06λ/(n-1) for transmission readout. if, for example, the hologram is to be reconstructed with 633 nm light (and the refractive index of the vinyl tape (on which the holograms are embossed) is 1,4, then the depth of the pattern should be approximately 0,1 μm which agrees reasonably well with surface corrugations shown in fig.4.
iii. noise in hologram images
a. required signal-to-noise ratio
a basic requirement in holographic movie systems is that the signal-to-noise ration (snr) of the Image reconstructed from a small hologram be a c c e p t a b l y high. this is by far the most challenging problem holographers face in this field. for the holotape application s m
a l l implies a hologram size of about 1/λ x 1/4 inch.
picture quality standards established by the television allocation study organization (taso) are listed in table i. applying these standards to holotape requires that they be properly weighted to compensate for the fact that noise prevalent in holotape images is not like the white noise seen
|
picture rating
|
snr |
|
excellent(no perceptible snow)
|
45 db |
|
pine(snow just perceptible)
|
35 db |
|
passable(snow definitely perceptible but not objectionable)
|
29 db |
|
marginal (snow somewhat objectionable)
|
25 db |
table 1. picture rating vs. signal-to-noise ratio.
in a home tv picture. instead, it is peaked at low frequencies where, unfortunately, it is more apparent to the viewer. to further complicate the situation, the signal-to-noise ration is strongly dependent on the nature of the object transparency from which the hologram is made. holograms made from transparencies of scenes with much fine detail and dark backgrounds yield highar apparent signal-to-noice ratio than holograms of scenes with broad white areas.
yet another complications is the confusion that frequently surrounds the definition
of signal-to-noise ration itself. in optical systems signal-to-noise ratio is
usually expressed as the ratio of average light intensity to rms fluctuation
in intensity, whereas in television systems it is usually expressed in terms
of is and in, the signal and noise currents derived from
a tv camera, and written as 20log(is/in)db. since the
output current of all camera tubes depends on the light intensity (or power),
the corresponding expression in terms of equivalent light intensity ratio is
 where i is the average light
intensity incident on the camera tube and
  expresses the mean square value of incident light intensity. (apparently, the
confusion arises because this is equivalent to taking 10 log (power ratio)2.
) for example, a tv engineer would consider an Image with an
  ratio of 100 as a 40 db picture.
for the reasons cited above, it is difficult, if not impossible, to define the lower bound on acceptable signal-to-noise ratio. nevertheless, a rough rule-of-thumb, established by subjective evaluation of images reconstructed from state-of-the-art holotapes, is that required signal-to-noise ratio is about 5 to 10 db higher than the values listed in tablel, indicating the threshold of acceptability is about 35 db. hopefully, further advances in the state of the art will improve the whiteness of the noise to the point at which the values listed in table 1 are applicable to holotape.
b. sources of noise
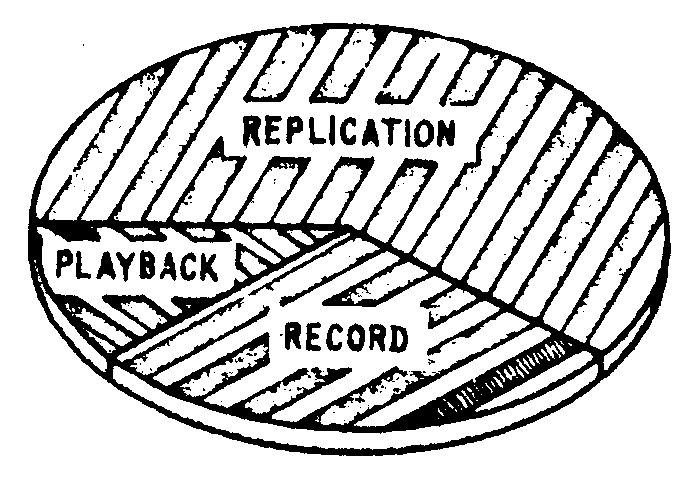 noise which plagues holographic
novie systems is distributed roughly as illustrated in fig.6. this disstribution
is subject to radical change, of course as the state-of-the-art advances. but
right now replicatio is by far the weakest link in the system. the origin of
noise in recording, replication, and playback, and steps one can take to reduce
these noise sources are fig.8. distribution of noise.
discussed below.
1. intermodulatlon noise
a rigorous analysis of intemodulation noise is extremely complex because of the nonlinear nature of the problem. even if one were ambitious enough to carry out such an analysis, it would be of little practical value because the results would be difficult to interpret in terms useful to a television engineer. there are two reasons for this. first, the nonlinear characteristics of recording materials and, in the case of phase holograms, the intrinsic nonlinearity of the recording process, cause the intermodulation noise to be a function of the signal itself. in other words, the signal-to-intermodulation noise is dependent, to a certain extent, on the structure of the object. and, second, since intermodulation noise does not have the same characteristics as the white noise commonly seen or home tv sets, the standard definition of signal-to-noi-
se ratio (i.e., the ratio of peak video signal to rms noise) is not too meaningful.
nevertheless the origin of intennodulation noise and the steps one must take to reduce it can be determined by an extention of the analysis given in section "relief-phase holograms". in that analysis, the object beam was a plane wave and therefore a0a0*=a02 was a constant. but in a complex object a0a0* is not a constant. it is interesting to note that this is of no practical significance in a m p l i t u d e holograms because these holograms are recorded such that transmission (or attenuation) is proportional to intensity:
ta
αa0a
0*+a
r2+a
0*a
re
xp(iωxx)+a
0a
rexp(iωxx) (19)
and consequently the noise associated with a0a0* can be avoided simply by making ωx high enough to spatially separate the de sired signal from the a0a0* spectrum (e.g., by making ωx>3ω0, where ω0, is the highest spatial frequency in the object).
unfortunately, spatial filtering is not a complete solution in the case of phase holograms. this is evident from eq.(8) which shows that the desired signal (i.e.,
exp [i2(n-1)kg a0arcosωxx cosφ]
is multiplied by exp[i(n-1)kg a02]. for a complex object, the multiplication factor is exp[ikg(n-1)a0a0*] which, as mentioned previously, is not a.constant. consequently, the signal itself is a source of noise.
it is well-known that intennodulation noise caused by the nonlinear characteristics of recording materials can be suppressed by employing a high reference-to-object beam ratio. in effect, this causes beats between the signal and reference beams to predominate over beats among the signal components themselves. for this reason, the reference-to-object beam ratio is
a /_ usually set at ar/Ā0=10, based on measuring the average intensity of the worst case object. where the object is movie film, the worst case corresponds to the scene having broad, bright areas which give rise to hot spots on the re -
cording, especially if the hologram is recorded near the fourier transform plane. such h o t s p o t s may run exposure beyond the linear range of the recording material and thus cause intennodulation noise. it follows that a tradeoff exists between intermodulation noise and hologram efficiency.
the efficiency of phase holograms recorded on photoresist-coated tapes can approach 30% when the object is, for example, a small white dot on a black background. however, as previously mentioned, for typical movie scenes the efficiency is usually restricted to about 3% so that acceptable signal-to-intermodulation noise can be achieved. an example of the tradeoff between intennodulation noise and efficiency is shown in fig.9. the images shown were reconstructed from holograms recorded on az-1250 photoresist; readout wavelength was 652,8 nm
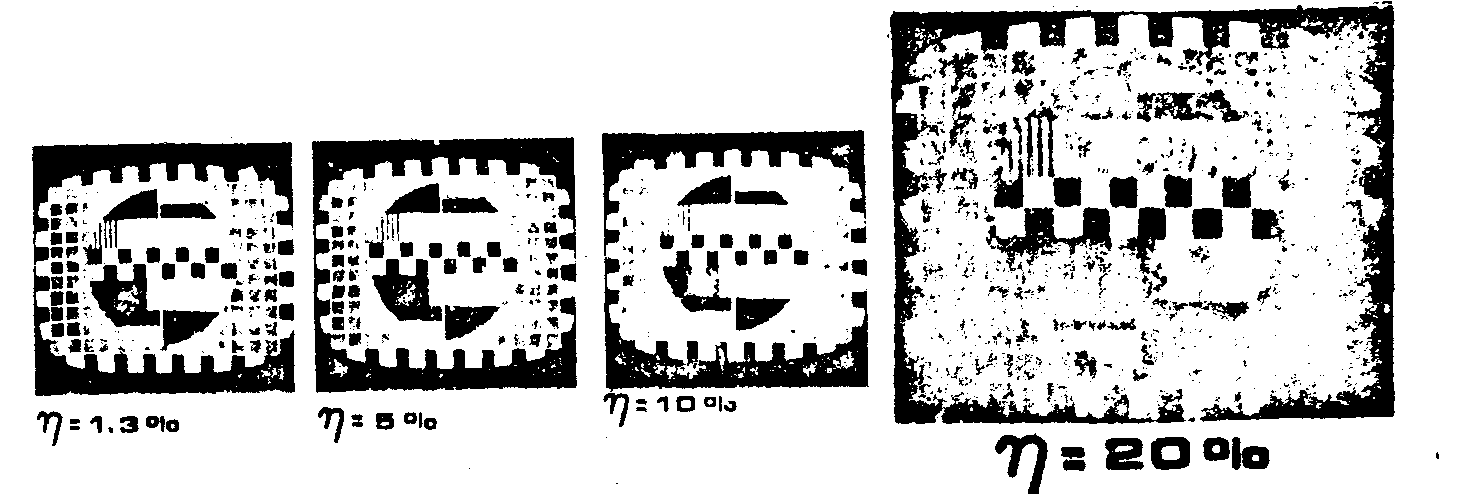
fig.9. quality of reconstructed images as a function of hologram efficiency.
much higher efficiency has been achieved using thermoplastic recording materials, typical efficiency of a reconstructed Image such as a tv test chart being on the order of 20% /8/ with little intennodulation distortion. the higher efficiency has been attributed to the superior linearity of thermoplastic materials have a bandpass rather than a low-pass spatial frequency response. much materials research remains, however, before this type material has the predictable properties needed for recording holographic movies.
2. speckle noise
early research in holography /9/ revealed that holograms made from diffusely illuminated or diffusely reflecting objects have unique noise suppression properties. these holograms have a very high degree of redundancy because information from every point on the object is spread all over the hologram; conversely, every point on the hologram contains information about the entire object. as a result, such holograms can be scratched, spotted with dirt and even broken into pieces without serious loss of information, and they show little noise due to optical imperfections in the recording or playback systems. however, an unwanted by-product of diffuse illumination is speckle noise, the noise becoming nore severe as hologram size is reduced. assuming that the optical system is solely diffraction limited by a diffuse hologram of area ah, it can be shown /10/ that the signal-to-speckle noise ratio of the reconstructed Image is
 (20)
(20)
where (as defined in section "noise in hologram images, a.required signal-to-noise
ratio")  is the ratio of average
intensity to rms fluctuation; of intensity in the Image and amin
is the hologram area for which lease resolution just matches the resolution
of the display. the signal-to-noise ratio of actual diffuse holograms is probably
somewhat less than eq.(20). would indicate since optical defects in the system
are not considered in the a“rivation of tills equation.
from a transparency illuminated by diffuse coherent light with ah/amin ratios of 2, 4 and 8 it is clear, snr improves as the aperture size is increased; but, unfortunately, the size needed for an acceptable signal-to-noise ratio is prohibitively large for most applications, particularly for the high density hologntphic storaga damanded by movie systems.
note that speckle can be eliminated simply by not using diffuse illumination; but then there is no redundancy and, as discussed below, the reconstructed Image is plagued by cosmetic defects in the optical system.
3. cosmetic noise
in order to obtain the benefits of holography mentioned in the introduction (e.g., sctratch resistance and Image immobilization), it is necessary to use highly coherent light for both recording and playback. unfortunately, coherent light tends to exaggerate the noise caused by c o s m e t i c defects, arising from minute actratches, dimples, bubbles, thickness variations, reflections and dust in and on the recording system components. cosmetic defects are usually indiscernible with incoherent illumination but, they can be, and.usually are, a very serious problem with coherent illumination.
experience has shown that it is not possible to build an optical system that is so free of defects, and kept so clean, that the cosmetic noise is reduced to an acceptable level. even if such a system could be built, it would certainly not be holotape. one of the main advantages of holotape is its insensitivity to such defects, in particular its ability to produce good pictures from a loq cost release medium of poor optical quality. fig.10a illustrates one measure of the quality of typical vinyl material presently used for holotape replicas. in the interferogram shown, each dark line represents a change in thickness of half a wavelength, or about 0,3 m. a uniform, flat material would exhibit a uniform shade of gray. the thickness variations are obvious. for comparison, the interferogram of a high quality polyster film is shown in fig.10b.
srom the above discussion it is clear that achieving satisfactory performance from a coherent imaging system such. as holotape demands that a technique be developed for suppressing
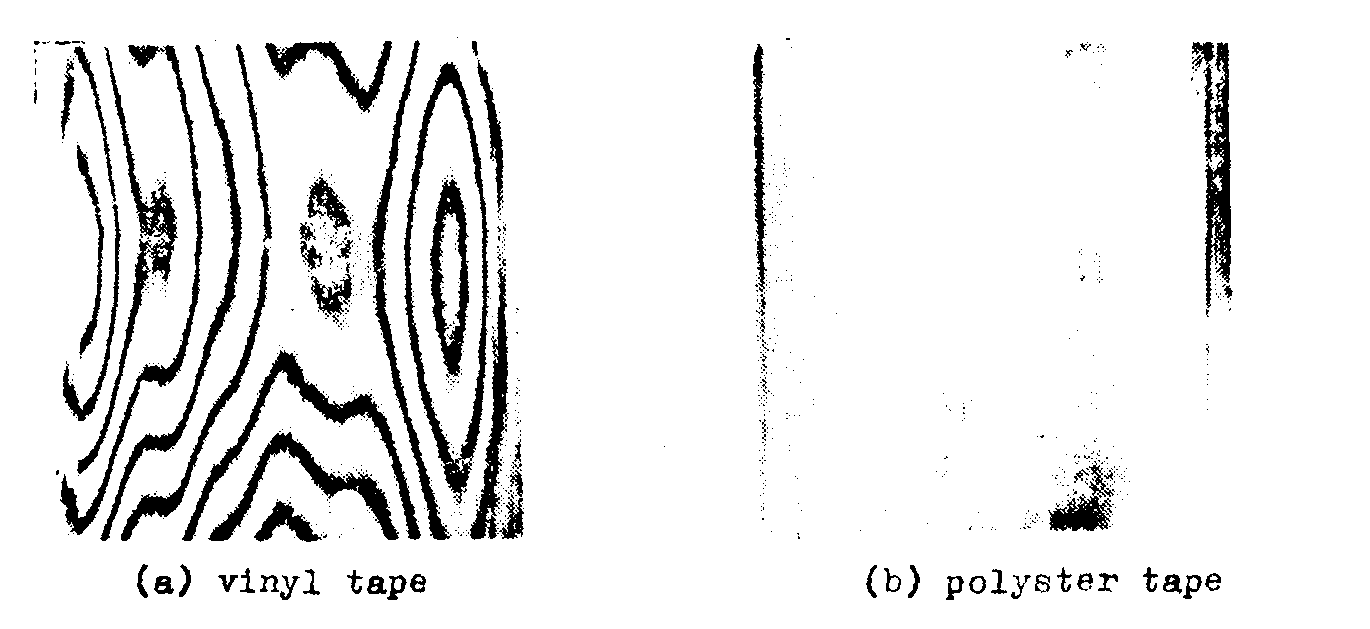
fig.10. interferograms of tape materials.
cosmetic noise. a major step in this direction is the redundant holographic recording technique described in the next section.
iv. redundancy
as introduced above, the highly redundant nature of holograms recorded with diffusely illumination or diffusely reflecting objects renders them practically immune to cosmetic noise /9/. but, as discussed previously, such holograms are plagued by severe speckle noise. therefore, the question that arises is: is it possible to illuminate an object transparency so as to record redundant holograms without introducing speckle or some other form of spurious background pattern? as shown next, the answer to this question is yes. it nan be achieved by multiple beam illumination of the object transparency /7/.
a. multiple beam holograms
multiple beam illumination is based on the principle that the paths of rays propagating through, any optical system can be changed by changing the location of the source of object illumination, without changing the location of tha Image. therefore, if an object is illuminated by many different sources, light
form each source will experience different degradations, and thus noise introduced by optical defects will be diminished. this noise suppression effect is somewhat analogous to the noise suppression that is observed when a movie projector is switched from static to dynamic projection. noice that is uncorrelated from one frame to the next tends to average out.
thus a basic approach to recording redundant, speckle-free holograms involves illuminating the object transparency with a multiplicity of beams, the angular spacing between beams being sufficient to ensure that the spatial frequencies of all periodic interference patterns at the Image are beyond the resolution capability of the overall system. the redundancy of such m u l t i p l e b e a m holograms is equal to the number of object illumination sources. each source records a s u b h o l o g r a m that is capable of reconstructing the entire Image. clearly, if one portion of such a redundant hologram is mutilated or even obliterated, other parts of the hologram still reconstruct the entire Image. similarly, since the light which forms each portion of the reconstructed Image has experienced different degradations upon passing through the optical components, noise introduced by these components, regardless of whether they are introduced in recording or playback, will be diminished.
the following simple analysis clarifies the signal-to-noise advantage of a m u l t i p l e b e a m hologram over an equal area diffuse hologram.
if noise in a m u l t i p l e b e a m hologram is uncorrelated from one subhologram to the next, which is usually the case, then signal-to-noice ratio is given by
 (21)
(21)
where (s/n) is the signal-to-noise ratio of a subhologram and r is the redundancy of the hologram. later we will see that the relationship between redundancy and holggram area ah is
 (22)
(22)
where amin is the hologram area for which the diffraction limited resolution just matches the resolution of the display,and is an integer equal to or greater than 1.
in highly redundant multiple beam holograms the noise seen in the reconstructed Image has characteristics similar to speckle; therefore, by combining (20), (21) and (22),we find that
(snr)multiple beam = ρ(s/n)snrdiffuse, (23)
which indicates that the relative signal-to-noise ratio advantage of a multiple beam hologram over a d i f f u s e hologram is ρ(s/n). fortunately, the condition ρ(s/
n)>1 is not too difficult to achieve in practice. it must be remembered, however, that it is not only necessary to exceed the signal-to-noise ratio of a diffuse hologram but it is also necessary to ensure that the resultant signal-to-noise ratio is high enough to satisfy a tv viewer. as shown next, the key to soccess lies not only in applying the "good housekeeping" practice required to maximize (the signal-to-noise ratio of a nonredundant subhologram), but also in the manner in which the multiple beams are generated and utilized.
b. techniques for generating multiple beams
1. phase grating
an early attempt to record multiple beam holograms involved illuminating the object transparency with a beam that had passed through a two-diinentional sinusoidal phase grating /10/. this type grating has transmission given by /10/
 (24)
(24)
where jn
is the nth order bessel function of the first kind, Δ is the spatial period of the grating, and Φ is the peak phase shift introduced by the grating. a grating with Φ=1,43 radians produces nine equally intense beans, allowing nine-fold redundancy to be acieved. however, although images reconstructed from holograms with nine-fold redundancy are speckle-free and have reasonably good dirt and scratch resistance, it is evident that further improvement can be realized by employing more than nine-fold redundancy, provided larger holograms can be used.
to give a concrete example of the redundancy that can be obtained from a reasonably sized hologram, we will consider the case where a standard tv system having a bandwidth b=3 mhz and a horizontal scan period of th=53 s is used to read out reconstructed Image. for an Image width of w=10 mm, the lowest spatial frequency that must be resolved is pw=bth/w = 15,9 c/mm. for a fraunhofer hologram recorded with a hecd laser
(λ = 441,6 nm) and a recording lens with a focal length of f=50 mm, the minimum hologram width is w = 2pwf = 0,71 mm. preventing beats with the tv raster structure calls for a vertical resolution of at least pv = 31,8 c/mm, indicating a minimum hologram hieght of v =1,42 mm. thus the minimum area of a subhologran is amin= wv= (0,71)(1,42)=1 mm2. it follows that a reasonably small hologram, say one having an area ah=(6)(11) = 66 mm2, could be recorded with a redundancy of r=ah/amin=66. thus we conclude that more than nine-fold redundancy can be accomodated by reasonably small hologram. therefore, a need exists for a device that can generate more than nine equally intense beams.
it is theoretically possible to fabricate a two dimensional phase grating which produces more than nine equally intense beams by exposing a phase recording medium through a grating (absorption or phase) having high harmonic content with all beams masked except the two first orders, the two second orders, the two third orders, and so on for successive exposures,
with exposure times adjusted to yield equal amplitudes in the harmonic components of the ultimate grating. however, difficulties associated with nonlinear characteristics of recording materials and ootunetic imperfections in optical components have thus far prevented practical realization of such a grating.
2. mirror array
it is also theoretically possible to use an array of mirrors to generate a multiplicity of beams. however, proper alignment requires that the spatial frequency of the interference pattern produced by each pair of mirrors differ from the spatial frequency of any other pair of mirrors by at raost one half cycle across the object field. this is required because the vidicon response, as well as that of most other light detectors, is a nonlinear function of light intensity. this nonlinearity generates coarse intensity beats between the fine interference patterns produced by mirror pairs. maintaining proper alignment to prevent these beats is prohibitively difficult for most applications.
3. pinhole array
an alternate approach, which offers not only a practical solution but also yields redundancy higher than, is to employ fresnel images /11/ of an array of pinholes whose periodioity is coarser than the sampling periodicity required by the object bandwidth. if this relatively coarse array of pinholes is illuminated by coherent light, then exact images of the array are formed at finite distance from the array. additional images called f r e s n e l images are formed at distances intermediate to where the exact images are formed. some of tbaae intermediate images are arrays of points whose periodicity in much finer than that of the origin coarse array. for example, when a square array of 0,1 mm periodicity is illuminated with 441,6 nm light, a square array of 0,02 mm periodi -
city is formed in space at a distance of 9 mm from the original array.
by locating the object transparency at one of the fresnel images, it is possible to record holograms having redundancy much higher than that given by r=ah/amin. such holograms are, however, particularly sensitive to certain typse of system defects, which show up as a background pattern having the coarse periodicity of the original array. therefore, great care must be exercised in the application of amounts of redundancy greater than r=ah/amin, the f a i l s a f e redundancy limit, and go beyong this limit only if the system can tolerate the requirements of higher fidelity. some insight as to how far one can go in this direction can be gained from the following analysis.
c. analysis of pinhole array recording method
consider the redundancy device to be an array of perfect point sources located a distance z from the plane of ths object transparency, as shown in fig.11. assume that each point source completely illuminates the object and that none of the light buffers from vignetting elsewhere in the system. how, since each unvignetted point source of the array will reconstruct the entire object with uncorrelated noise, the signal-to-noise ratio of the total reconstruction can be expected to increase as the square root of the number of points in the array. it follows,of course, that we want as many points in the array as possible. moreover, since suppression of spurious background patterns ultimately sets the lower bound on point separation,, it is evident that a regular array, (rather than a random array) with all points equally intense is called for.
with these facts in mind, our analysis proceeds in the following fashion. we consider a holographic system with a white field object as reproducing a distored Image; of the redundancy device. we then determine what the intensity pattern on the the
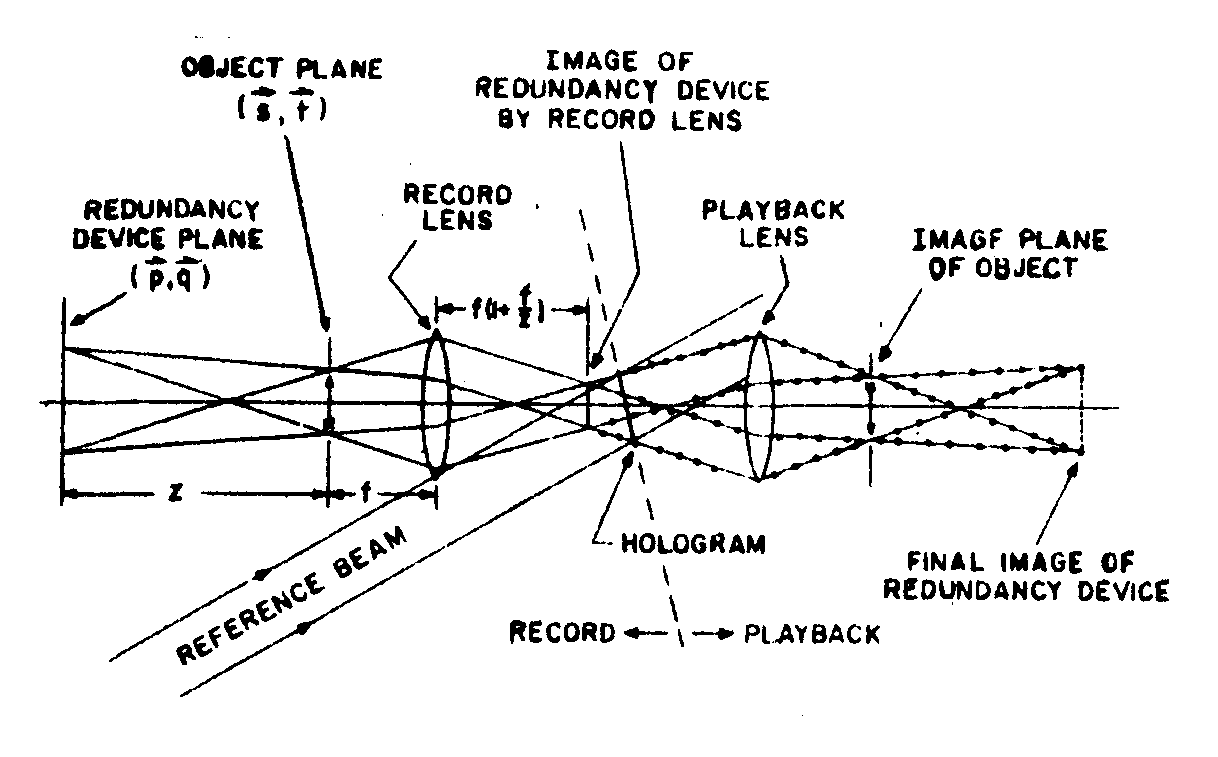
fig.11. multiple object beam record/playback system ; for fraunhofer holograms.
reproduced object field is, due to the distorted Image of the redundancy device.
any degradation in the Image of the redundancy device can be modeled by two system filtere: (1) convolution of the perfect redundancy device with one complex filter, and (2) multiplication by a second complex filter. the object itself is a filter of the first type while a field stop for the redundancy device is an example of the second type. we denote these two filters as nc and nm and for convenience we consider the convolutional filter nc to be located at the plane of the object or its Image.
while the multiplicative filter nm is located at the plane of the redundancy device or its Image. we will consider only the effects of the multiplicative filter n. the effect of the convolutional filter nc is trivial; the object intensity is modulated by in |nc|2 since we assume it to be located at the plane of the object or its Image.
thus for a redundancy device consisting of an array of point sources located
on a lattice whose basis vectors are  and
and  , in a plane perpendicular
to the optic axis,
  , as shown
in fig.12a, the complex field amplitude at r1, the plane of the redundancy
device (see fig.11), is
 (25)
(25)
 (26)
(26)
are integers, and umn is the complex field amplitude of the point
source at  as modified by multiplicative
system filter nm.
by applying the usual parabolic approximation to the fresnel-kirchhoff equation,
the complex field amplitude produced by this modified array of point sources
at point ( ; z) within the
object plane can be expressed as
 (27)
(27)
where k=2π/λ.

fig.12. coordinate system of (a) redundancy device space and (b) reciprocal lattice space.
to describe the location of points within the object plane it is convenient
to define a new coordinate system in terms of the reciprocal lattice of  and
and  /11/. this new coordinate
system, illustrated in fig.12b has basis vectors
  and
and  defined by
 and
and  (28)
(28)
these new basis vectors have the property that

 (29)
(29)
expressing  in terms of these
basis vectors as r0
=αs+βt
(27) can be written as
 (30)
(30)
our interest, however, is, not in the complex field amplitude at the object plane but rather the intensity at that plane. the intensity i(α,β;z) is the squared magnitude of the complex f
ield amplitude; i.e.,
 (31)
(31)
the intensity pattern in the object plane, i(α,β;z) can be rewritten as
 (32)
(32)
where
 (33)
(33)
equation (32) expresses thu intensity at the object plane as a fourier series
with the basic periodicity of the s, t lattice, never coarser. no matter
how the multiplicative filter modifies either the magnitude or the phase of
the point sources in the redundancy array, the object plane pattern will never
have patterns coarser than the basic periodicity of the s, t lattice. however,
if the modified redundancy array maintains equal intensity and cophasarity of
all points then intensity patterns finer than the s, t periodicity can
be achieved. for example, for the particularly simple case of a rectangular
array, i.e.,  = 0, it can be
shown that a distance z can be chosen such that (kp2/z) =
2π(h+1/j) where h and j are integers. now, if all umn
are equally intense and cophasor and x satieties the above relation, then the
only nonzero imn are those for which m= 0, j, 2j, 3j... these distances
are the object plane locations where the illumination periodicity is j times
the periodicity which is expected if the array points are not cophasor or equally
intense. thus, with equally intense cophasor point sources, a distance z can
be found for which the basic spatial pattern repeat frequency in both the  and
and  directions can be multiplied
by an integer. it is important to note that multiplicative modifications of
the point sources can be used effectively only as long as the optical fidelity
of the overall system is adequate. if optical imperfections destroy the amplitude
and phase relationships among the modified point sources, the intensity pattern
at the object plane will revert to the basic
  ,
,
 periodicity. needless to
say, the higher the sought for harmonic of the
  ,
,
 periodicity the more difficult
it is to achieve. by way of example, the jth harmonic in the direction imposes
amplitude and phase requirements over groups of j point sources in the modified
redundancy array.
before considering a specific application of this theory let us derive the maximum redundancy which we can achievei assuming equally intense but r a n d o m l y phased point sour-
cee in the modified redundancy device. under these сircumstances the intensity
pattern on the object plane will have the basic
 ,
,
 periodicity. referring back
to fig.11 we see that the redundancy device is Imaged in holospace (i.e., near
the recording plane). if our hologram is of finite size, the number of array
points whose light can pass through the system without vignetting will have
an upper bound set by the number of points in the holoapace Image of the array
which fit within the hologram area ah. as mentioned previously, the
redundancy r is the hologram area ah divided by the area of each
subhologram. since the area of each subhologram is the area of unit cell in
the
  ,
,  lattice times the square of the linear magnification, (f/z)2, where
f is the focal length of the fraunhofer lens, redundancy is given by
 (34)
(34)
however, the unit cell area of the  lattice is related to the unit cell area of the reciprocal lattice, as,
by
 (35)
(35)
thus in terms of the area of a sample on the object, as, the redundancy is
 (36)
(36)
randomly phased point sources generate a periodic background pattern corresponding to the fundamental of the array and higher harmonics. as shown in appendix a, the ratio of average signal intensity to rms variation in intensity of the fundamental component of the background pattern is
 (37)
(37)
where is the number of point sources. for example, if the redundancy device
generates 400 randomly phased point sources, the signal-to-background noise
ratio will be  =10=20db.
since periodic structure is usually quite noticeable in an Image, the use of a randomly phased array of point sources demands that the fundamental frequency of the array be higher than the highest frequency component in the Image. therefore, any increase beyond the redundancy given by (36) will involve dependence on m u l t i p l i c a t i o n of the affective sampling rate as discussed previously.
an alternate way to express redundancy, which may be somewhat more informative, can be derived as follows. assume the recording setup is designed to operate in the fundamental or f a i l s a f e matte. this means that the f u n d a m e n t a l component of the array must correspond to at least twice the highest spatial frequency of the object transparency, as demanded by sampling theory. it follows that the area corresponding to the spacing between subholograms is equal to amin, the smallest area for which the diffraction limited resolution of the reconstructed Image just satisfies desired resolution. therefore, hologram redundancy is simply r=ah/amin
. on the other hand, if the recording setup is designed to operate in the ρth mode, i.e., the ρth harmonic corresponding to at least twice the highest spatial frequency of the object transparency, then the area corresponding to the spacing between subholograms is amin/ρ2. hence, the general expression for hologram redundancy is
r=ρ
2a
h/a
min. (38)
applying the foregoing results to a practical system calls for designing a pinhole array and selecting a recording geometry which will provide the desired sampling rate at the piano of the object transparency. once the desired sampling structure is established one can design an appropriate pinhole array such
that the fundamental  ,
,  periodicity provides the desired sampling rate. one can then go on to design
geometrically similar arrays of finer structure which will yield higher redundancy.
but, as mentioned previously, the finer structures can be used effectively only
if the optical fidelity of the system is high enough to ensure that tho fundamental
 ,
,  components will be adequately suppressed.
it is theoretically passible to calculate the increase of redundancy that can be achieved through multiplication, given sufficient amplitude and phase statistics of the overall optical system. however an experimental approach has proved to be the shortest route to determining maximum redundancy.
as an example of how this can be accomplished, let us consider a typical tv playback system with tliese parameters:
object frame size..............……………..........12,2 x 7,8 mm
focal length of fraunhofer lens….………….50 mm
recording wavelength.................…………...441,6 nm
hologram size.......................………………..6,4 x 11,1 mm
tv bandwidth.........................……………... 5 mhz
as a starting point we will consider the snr that can be achieved without relying on multiplication on the basic s, t periodicity. accordingly, the sampling structure shown in fig.13 represents a good design compromise between achieving high re-
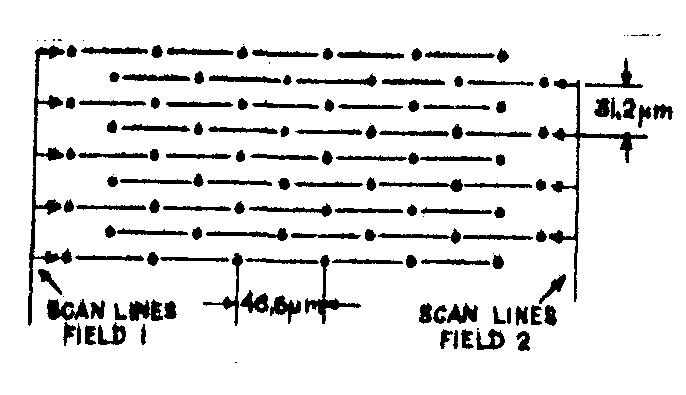
fig.13. sampling structure for tv playback system.
dundancy serious beat problems. for this structure
as = 7,15 x 10⁻⁴ mm2,
providing 104-fold redundancy on the 6,4 x 11,1 mm hologram.
experimental results show that when such holograms are replicated on commercial grade vinyl a low frequency snr of 36 db is realised. since this snr is barely acceptable, it is desirable to invoke multiplication of the effective sampling rate to achieve higher redundancy. doubling, for example, would yield 416-fold redundancy which in turn would increase the snr to 42 db.
fortunately, experimantal results show that the overall optical fidelity of a holotape system, including vinyl tape, is sufficient to maintain reasonably good suppression of the fundamental component.
v. practical aspects of embossed holographic movie system
a. fraunhofer holograms
the two major classifications of hologram recording geometries are fresnel and fraunhofer, by analogy with the concepts of fresnel (near-field) and fraunhofer (far-field) diffraction. if a lens is placed a focal length away from an object transparency the fraunhofer diffraction pattern is obtained on the other side of the lens. a hologram formed with this diffraction pattern as the object beam is classified as a fraunhofer hologram. holograms of the fraunhofer type are sometimes called fourier transform holograms when the hologram is recorded at the back focal plane of the lens.
fraunhofer holograms produce an Image that remains stationary when the hologram moves. this property can be explained by examining how such holograms are recorded. fig.14 shaws an arrangement used for recording a fraunhofer hologram of a point object at p. any object transparency can be thought of as composed of many point objects of different intensities. since the lens is placed one focal length away from these point objects,
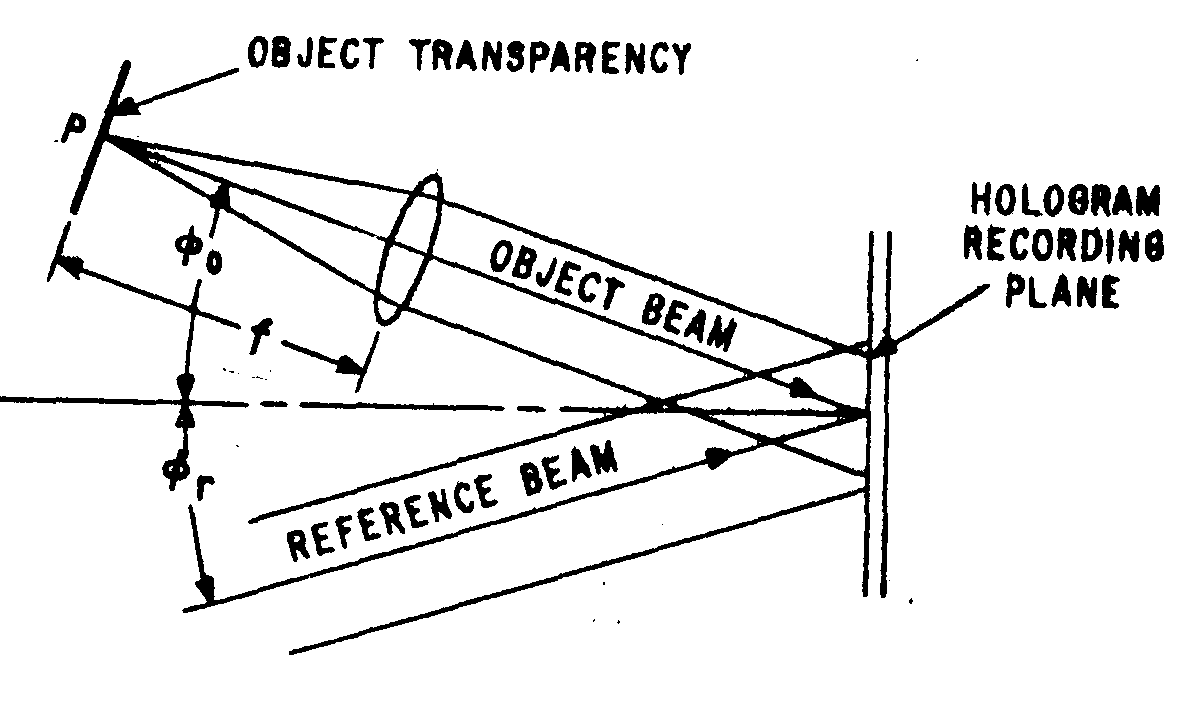
fig.14. fraunhofer hologram recording arrangement for a point source.
the wavefront leaving the lens due to any of these points is plane. the recorded pattern resulting from interference with a plane refemce beam is simply a sinusoidal grating with a spacing d of
d=λ/(sinθ
r+sinθ0), (39)
where λ is the wave
length of the recording laser, θ0 is the angle between the reference beam and optic axis. when this grating is illuminated with a beam at angle θr, the angle of the first order diffracted beam is
θr. this angle is
independent of translation of the grating, and it is this angle that determines the location of the Image point. since any one point in the Image is insensitive to translation of the hologram, the entire Image is also insensitive to such motion. this characteristic of the fraunhofer hologram makes possible the readout of a tape containing holograms of a motion picture sequence
without the need for a shutter, pulsed laser or servo control between tape speed and tv scan rate. also, since consecutive imagas simply fade from one frame to the next, a flicker-free Image can be obtained at any tape speed. this is a very attractive feature for movie systems in which variable speed playback is desired.
another feature of fraunhofer holograms is that alignment of the playback lens is not critical. this highly desirable situation occurs because the resulting Image is focused at infinity, making Image focus insensitive to the distance between the holotape and the readout lens.
the recording parameters for fraunhofer holograms can be determined in the following manner. fig.15 shows a detailed section of the fraunhofer hologram recording arrangement near the
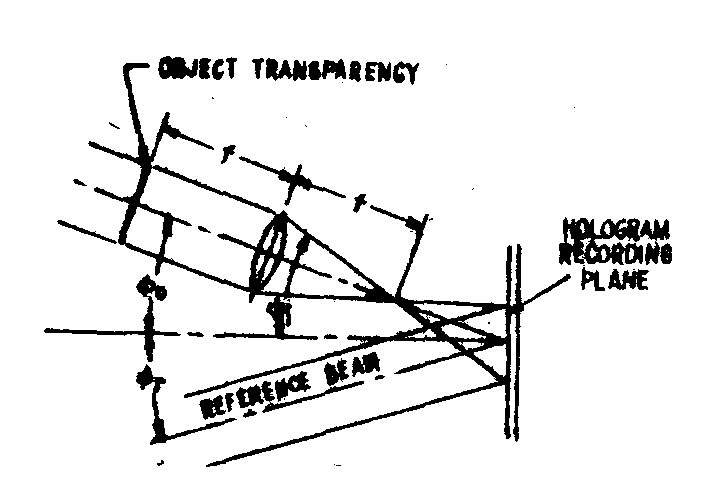
fig.15. detailed section of fraunhofer hologram recording arrangement.
recording plane. selection of the angular orientation of the reference and object beans is based on consideration of several factors. foremost among these is the spatial frequency resolution capability of the recording material. the spatial resolution capability of a given recording naterial is usually expres-
sed in terms of the highest spatial frequency it call reliably record, knowing this freqiency, the maximum angles between reference and object beams and the normal to the recording plane can be found from
 (40)
(40)
where fm is the maximum frequency resolution capability of recording material;
fc is the spatial frequency of the hologram;
2fi is the information spatial frequency bandwidth of tie object transparency;
λ is the recording wavelength;
θ
r is the angle between reference beam and normal recording plane;
θ
i is the maximum angle between object beam and normal to recording plane.
while this equation yields maximum reference and object bean angles based on maximum resolving power of the recording material, we must also be concerned about minimum angles in order to avoid hologram spectrum overlap. to avoid spectrum overlap, fc>>3fi
as an example, consider the use of shipley az-1350 photoresist for recording phase holograms with a standard 16 mm movie frame serving as the object transparency. the spatial frequency response curve for az-1350 shown in fig.16. indicates the maximum recording frequency is fm = 1500 lp/mm. therefore, a reasonable design compromise indicates setting fc = 1200 lp/mm, corresponding to θ0 = θr = 15° for a recording wavelength of 441,6 nm. thus an information bandwidth of 2fi = 450 lp/mm or fi = 225 lp/mm (corresponding to recording a 10-mm wide movie frame with a lens having a focal length of 50 mm) can be accomodated within the resolution limit of the recording material. (choice of 50 mm for the focal length of the lens is dictated by physical limitations imposed by practical design of object
film and recording tape transports).
a typical arrangement for recording praunhofer holograms is illustrated in fig.16. as shown, the beam from a he-cd laser (441,6 nm) is split into two parts that are redirected to the recording plane by mirrors. each beam is separately expanded. one
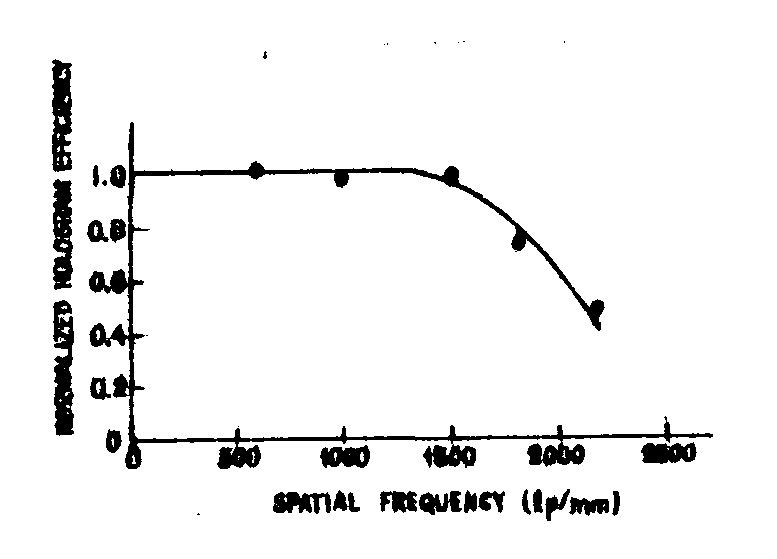
fig.16. typical fraunhofer recording arrangement.
beam goes directly to the recording plane as the reference beam; the other passes through the redundancy device to the fraunhofer lens and then to the recording plane. note that the recording plane does not have to be the fourier transform plane (or hack focal plane) of the fraunhofer lens, since it is the position of the transparency with respect to the lans that determines the fraunhofer nature of the recording configuration and not the location of the recording plane. usually a plane located a few millimeters either side of the fourier transform plane is selected for recording to avoid strong intensity peaks which lead to intermodulation distortion.
b. readout geometry
1. transmission vs reflection readout
relief phase holograms can be read out by either transmission or reflection. transmission readout, as will be seen, offers a, greater decree of Image immobolity when the hologram are subjected to an incremental rotation about the axial in the plane of the hologram. time-varying rotation (twist) is caused by imperfections in moving tape while fixed rotation may exist between subholograms of a redundant hologram due to a lack of perfect tape flatness. in any event, it is of great practical importance to choose a readout system which has the greatest degree of tolerance to tape twist and flattness, consistent with Image resolution requirements.
first, let us consider readout of a hologram by reflection. since a fraunhofer hologram of a point object, representative of one of the elemental areas making up the object transparency,is a linear diffraction grating, the worst-case Image motion due to hologram rotation would occur if the hologram were rotated about an axis parallel to the grating lines. the relationship between the readout beam angle β1 and the first order diffraction angle β1 as shown in fig.17a, is given by the grating equation
sinφ-sinβ
1=λ/d, (41)
where λ is the readout wavelength and d is the gratinf period. θ
=φ+ β1 is defined as the angle between the readout and diffracted beams. since the angular orientation of the readout beam is always fixed, with respect to the readout optics, all angular changes here are referenced to the readout beam. to find the change of the diffracted beam angle
θ, caused by a change of the readout beam angle φ, we first rewrite (41) as

fig.17. geometry for readout of a point-object fraunhofer hologram,
sinφ-sin(θ-φ)=λ/d.
(42)
differentiating (42) gives
d
θ/dφ=1+cosφ/[1-(λ/d-sinφ)2]1/2. (43)
this equation, plotted in fig.13a for a topical value of λ/d
= 0,7, shows that, as the readout angle is increases from 0°, the ratio of angular changes of the diffracted and readout beams decreases. in this example, when φ is 20°, β1 is - 20°. with this orientation, as seen from fig.18a, the change in the diffraction angle is exactly twice the change of the readout angle, corresponding to the relationship between reflected and incident beams obtained witn a plane morror. fig.18a also shows that the minimum sensitivity to change of the diffraction angle with an angular change in the readout beam occurs when tha readout angle is near the impractical extreme value of 90° (i.e., in the plane of the hologram), and even here the angular change of the diffracted beam would equal that of the readout beam.
fig.17b shows the readout first-order diffracted bead for transmission readout of a hologram. the relationship between the readout and diffracted beaas for this orientation is given by
sinφ+sinβ
1=λ/d. (44)
as before, all angular changes are referenced to the readout beam. defining
θ as the angle between the readout and firsi order diffracted beams, we now determine the change in θ caused by a change of the readout beam angle φ from fig.17b
β
1=π-φ-θ. (45)
substituting (45) in (44) gives
sinφ+sin(φ+θ)=λ/d
, (46)
which upon differentiation results in
 (47)
(47)
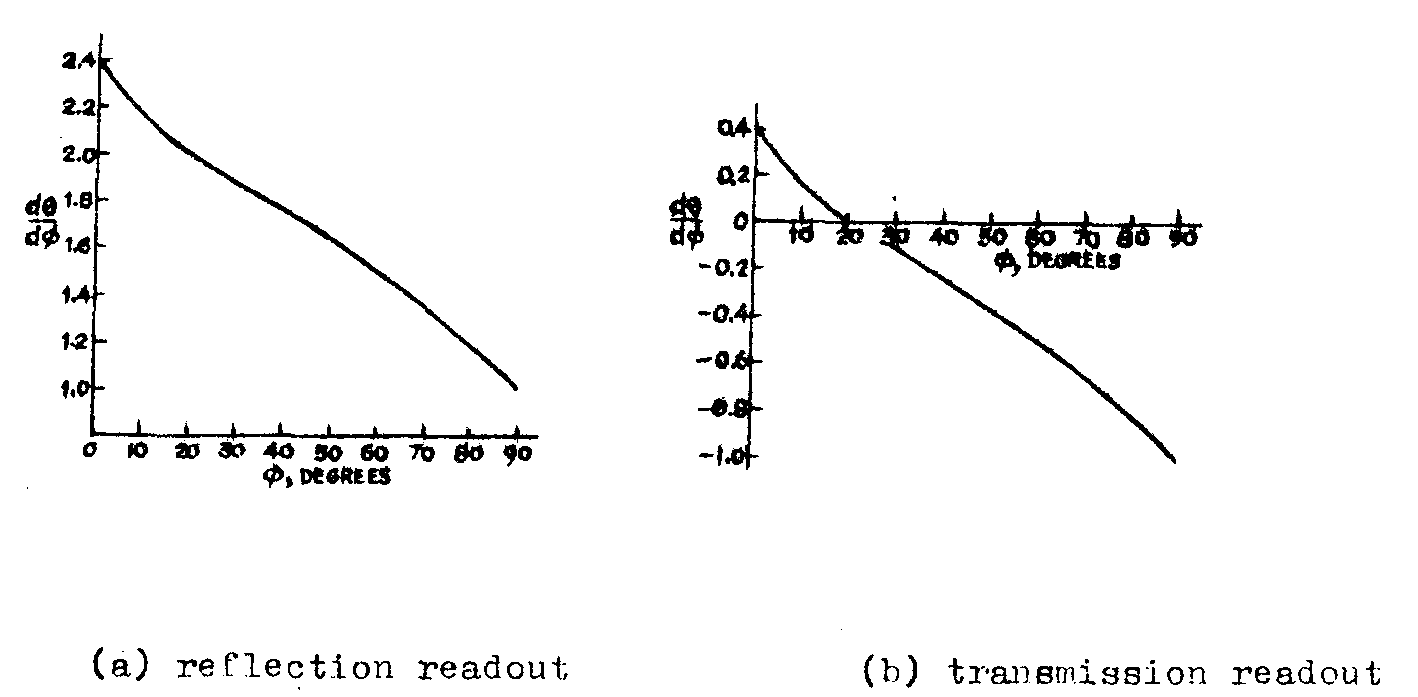
fig.18. rat
io of angular changes of the first-order diffracted beam and the readout beam as a function of the readout beam angle for λ/d = 0,7.
this equation, plotted in fig.18b for λ/d=
0,7, shows that with transmission readout there is an optimum value of readout beam angle for which dθ/dφ=0. letting dθ/dφ=0 in (47) indicates that the optimum readout angle occurs when the hologram is oriented such that the diffraction angle β1 is equal to the readout angle φ.
as an example, assume that the allowable Image displacement may be 30% of one period of a 5-mhz video signal. since the active horizontal scan time of the tv camera is 53
μs and the standard vidicon raster width is 1,27 cm, the allowable Image displacement is ±(0,3)(12,7)/(53 x 10-6) (5 x 10⁶)= ±1,44 x 10⁻² mm. if a 50-mm focal length lens is used to Image the reconstratec wavefront, the allowable angular displacement is ±(1,44 x 10⁻²)/(5 x 10) = ±2,9 x 10⁻⁴ rad. when the hologram is oriented for optimmi readout angle, rays diffracted from the center of the hologram will be making an angle of 20° with respect to a normal to the hologram for the example of fig.17b. the singular spread for this case is (1,27 x 101)/(5 x 10 ) = 0,25 rad (≈ ± 7°). the angular range of the diffracted beam is 20 ± 7°, corresponding to a dθ/dφ range of approximately ±0,06 at both edges of the hologram, according to (47). thus in order to confine the angular displacement of the portion of the wavefront reconstructed from the edges of the hologram to a maximum of ±2,9 x 10⁻⁴ rad, we need to limit the angular displacement of the hologram to ± 2,9 x 10⁻⁴/0,06 = ±4,8 mrad or ± 0,3°. this limit nay be relaxed even more with the use of redundant holograms which can reconstruct areas near the edges of the Image from central areas of the holograms.
playback arrangeirsents for fraunhofer holograms are shown in fig. 19. from a practical point of view, readout of the conjugate Image is usually preferred because it allows more distance between the holotape and the readout lens, thus simplifying mechanical design problems.
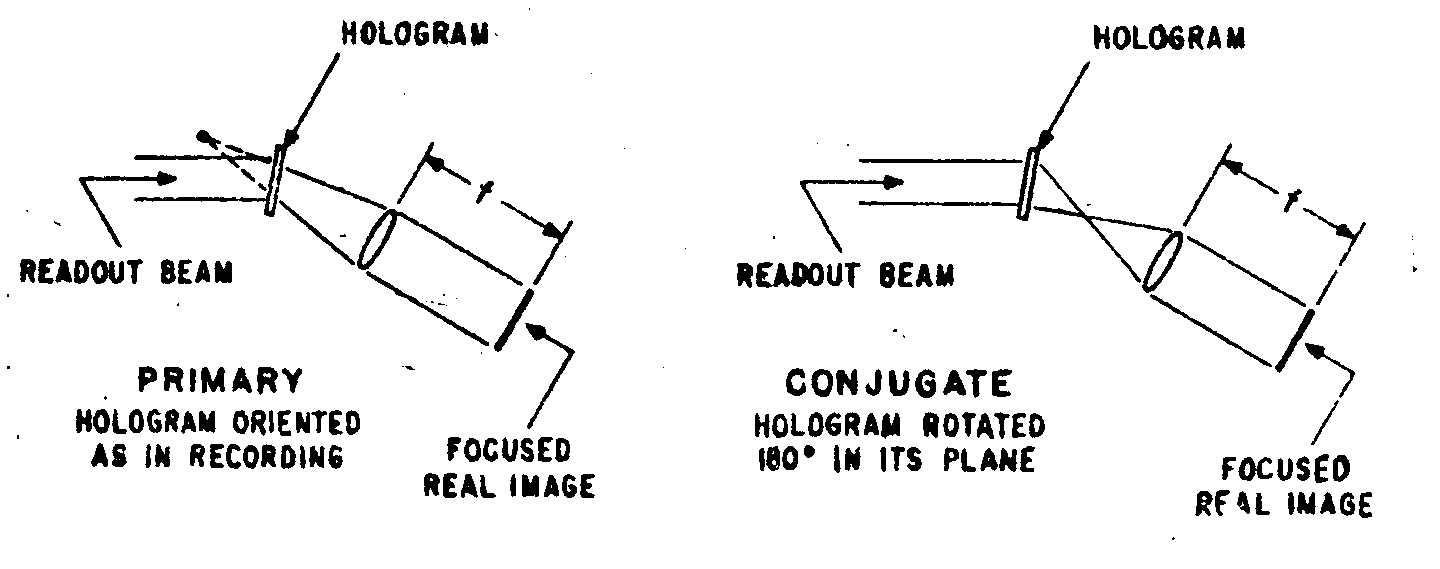
fig.19. transmission playback arrangenients for readout of fraunhofer holograms.
2. readout distortion
because of recording requirements (viz., photoresist sensitivity, the convenience of a visible wavelength, and available recording wavelengths), the relief phase holograms are currently recorded at 441,6 run. however reconstruction is usually performed at 632,8 nm because of the availability of low cost hene lasers. this wavelength difference causes distortion.
during recording, light of wavelength λ
1 = 441,6
nm from a point p on the object reaches the hologram as a plane wave at an angle θ0 with reaped to the normal to the hologram, as shown in fig.14.
the resulting hologram of this point is a simple grating. when reconstructed with a plane wave of wavelength λ2=632,8
nm, a diffracted plane wave is formed at angle θ0' given by
 , (48)
where β and β' are the reference and readout angles, respectively. when the readout angle is chosen so that sinβ/λ1=sinβ'/λ2'
sinθ'
0=(λ2/λ1)sinθ0. (49)
since θ'
0 is not a linear function or
θ0, the magnification over the Image varies, causing a small anou
nt of distortion for the limited range of θ0 in our system. there are no other aberrations due to the wavelength change for fraunhofer holograms, since a recorded plane wave corresponding to an object point is reconstructed as a plane wave forming an Image point.
3. spatial filtering
noise caused by scratches is a more serioue problem with transmission readout because the readout beam passes through both sides of the tape, the back side being particularly susceptible by the tape transport. burrs and hard dirt particles in the transport mechanism cause most of the scratches, the scratches being in the direction of tape motion. in conventional notion pictures these scratches are quite noticeable, especially when they extend over a number of frames. in hologram notion pictures, however, the scratches diffract the readout beam in a direction perpendicular to the scratches, causing a streak to appear across the Image. note that the scratches do not cause a significant loss of information, but the noise streak is quite prominent because all scratches within the readout beam contribute to the sane streak.
fortunately, there is an affective way to suppress noise caused by scratches parallel to the length of the tape. this is accomplished by simply recording the holograms such that the reconstructed images do not fail within the same spatial region as the diffracted scratch noise. in effect this is a form of spatial filtering that prevents noise caused by scratches along the tape from contaminating the Image.
c. color encoding
1.kell-sri encoding
the Image immobilization and scratch resistance afforded by redundant fraunhofer holograms necessitate the use of monochromatic light for playback. consequently, playback of color pictures calls for recording holograms of c o l o r e n c o d e d object transparencies. basically, color encoding amounts to recording the color signals as modulated carrier waves which show up on the object transparency as modulated grating patterns. there are, of course, many different color encoding schemes, the choice of a particular scheme depending on performance limits of the syaten in which it is used.
as an example, consider the kell-sri (stanford research institute) form of encoding shown in fig.20. here, luminance information is recorded as a 0-to 3 mhz baseband signal, and blue and red information as amplitude modulated 3,5 and 5,0 mhz subcarriers. (actually, the subcarrior frequencies differ slightly fromm these values, the true values being multiplies of the horizontal scan frequency). in the encoded imaga the color information appears as amplitude-modulated grating patterns. in a live tv camera the encoded signal is generated by an optical s t r i p e filter; in the holotape system the encoded Image is originally recorded on black-and-white movie film which subsequently serves as the object from which holograms are recorded.
during playback, the holotape produces a faithful reproductio of the encoded Image exactly as it appeared on the original black-and-white film. accordingly, the output of the tv camera consists of a 3-mhz luminance signal and 3,5 and 5,0 mhz subcarriers that are amplitude modulated by the blue and red signals resactively. appropriate filtering and envelope detection separate the blue and red signals. the green signal is obtained
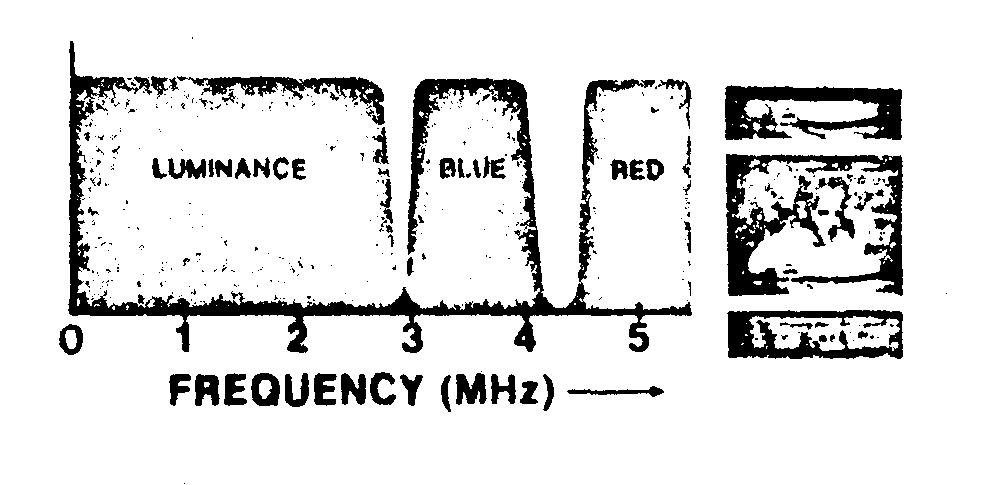
fig.20. spectrum of a kell-sri color encoded signal.
by subtracting, the red and blue signals from the luminance signal. finally, the color signals are passed through a color matrix circuit that combines them in the proper proportions to reproduce the hues and saturation a of the original color Image.
it is worth noting that the requirements of holotape differ radicaily from those of a live tv camera. in a live tv camera it is possible to control focus and other parameters affecting frequeucy response aild thus obtain reasonably good pictures. in the holotape system, however, it is difficult to maintain a specified frequency response because the encoded signal must undergo additional photographic and holographic processing. for this reason it is desiratle to utilize an encoding technique which does rot require the use of high video frequencies.
2. two frame f/2 encoding
the present holotape system employs the two frame f/2 encoding scheme /13/ illustrated in fig.21. briefly, this encoding method amounts to recording luminance and chrominance informa -
tion in two separate frames, the chrominance information being recorded on an ntsc-type carrier at 2 mhz. because of the scan nonlinearition that are inherent in all tv cameras, it is not possible to use the "burst" reference technique of conventional tv for conveying the phase reference which is essential for proper demodulation of the color signal. instead, a continuous phase must be recorded along with the chroma carrier. this phase reference is recorded as a carrier at half the chrominance carrier frequency, hence the name f/2 encoding. in the case of holotape, f/2 corresponds to 1 khz. during playback the f/2 carrier is detected and doubled to provide the 2 mhz phase reference needed for proper demodulation.
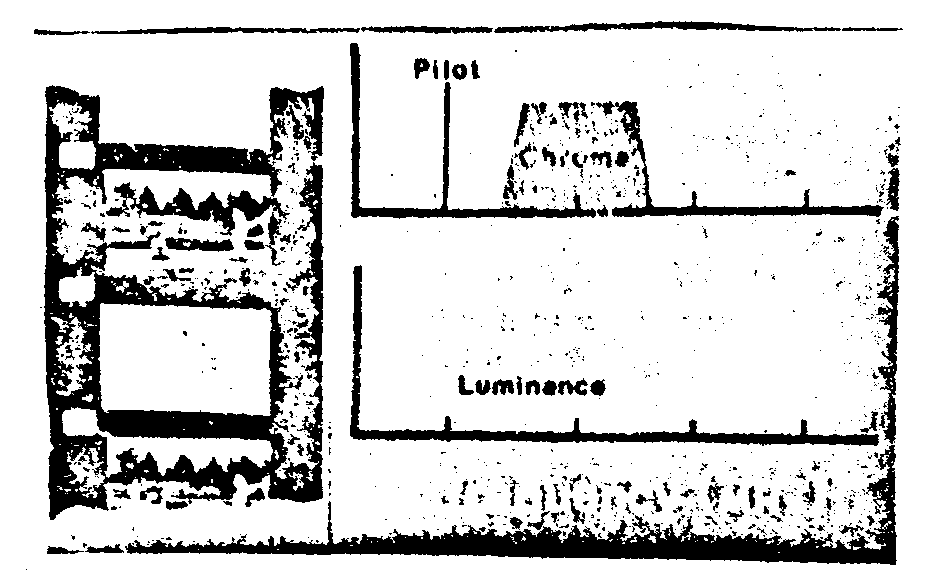
fig.21. two-frame f/2 color encoding.
briefly, two-frame color encoding offars these advantages:
camera noise - an snr of 40 db is considered adequate for a conventional tv picture, but it has been found that 50 to 60 db is required to obtain an acceptable picture with
one-frame encoding. the greater demand on snr stems from the poor noise performance of vidicons at high frequencies (due to aperture response and capacitance loading) and the subjective degradation of overall snr caused by translation noise from high to low frequencies during color demodulation. with two-frame encoding both luminance and chrominance informaton are recorded at the low end of the spectrum; hence, the snr requirement should be the same as that of conventional tv, implying that two-frame encoding has about a 10-db advantage over one-frame encoding.
hologram redundancy - recall that the snr of fraunhofer hologram images can be improved by increasing hologram redundancy. however, with one-frame encoding the degree of redundancy is severoly restricted by the necessity of preventing beats between the grating or pinhole array (used to record redundant holograms) and the color encoding stripes. recording luminance and chrominance information in two separate frames avoids the beat problem in the luminance frame and reduces it in the chrominance frane, thereby providing a substantial improvement in snr.
dynamic range - about 50% of the dynamic range is required to accommodate color information in a one-frame system. sacrificing this much range is particularly disheartening because the dynamic range is already severely restricted by linearity requirements. with two-frame encoding the full dynamic range can be used for both luminance and chrominance signals.
fall-to-luminance - encoding methods which convey some of the luminance information in carriers suffer from hue shift with changes in frequency response. with sri encoding, for example, poor focus at the edge of the raster causes the Image to have a green border. two-frame, f/2 encoding fails to luminance, a failure node which is much less disturbing to the tv viewer. therefore, with f/2 encoding, frequence response
is not a critical parameter.
direct translation to vhf carrier - another feature of f/2 encoding is that the encoded color carrier is identical to the ntsc color carrier; therefore, it can be neterdyned directly to the vhf band; i.e., it is not necessary to decode and subsequently reencode to generate the desired vhf carrier. the simplicity of this approach leads to greater reliability and lower cost.
tape transport - two-frame encoding allows chrominance information to be recorded in the low frequency portion of the spectrum without luminance-to-chrominance crosstalk problems. since the color encoding stripes are relatively coarse (compared to those of a one-frame syetem), frame-to-frame registration problens (imposed by vidicon lag) are not severe. therefore, the tolerance in the tape transport can be relaxed considerably.
growth potential - with one-frame encoding schemes, such as the kell-sri scheme (where the frequency spectrum just above the baseboard luminance spectrum is used for color information), it is not possible to increase luminance or chrominance bandwidth without changing system standards. this is not a severe problem as far as live cameras are concerned because standards can be changed without affecting equipment already in the field. however, once holotape standards are set it will be difficult, if not impossible, to change then. future r&d efforts will undoubtedly yield improved camera tubes, recording materials, etc., which, in turn, will enable higher resolution images to be realized. but if system bandwidth is set by rigid standards, rather than component limitations, improvement a will not be possible. two-frame systems do not suffer from this limitation.
3. bivicon® color camera
although early experiments with a two-vidicon color camera (one vidicon for the luminance and the other for the encoded color) were quite successful, the two-vidicon approach had two nerious drawbacks - high cost and registration problems. a major step toward solving both problems was achieved by developing a new camera tube, the "bivicon". as illustrated in fig.22, the bivicon is essentially a two-gun vidicon with a split target. since the beams from both guns are deflected by a comcion field, excellent registration is readily achieved. and, since only one deflection yoke and focus coil are needed and resolution requirements are legs stringent than those of a single vidicon color camera, the coat of a bivicon camera is comparable to that of a conventional single-frame color camera.
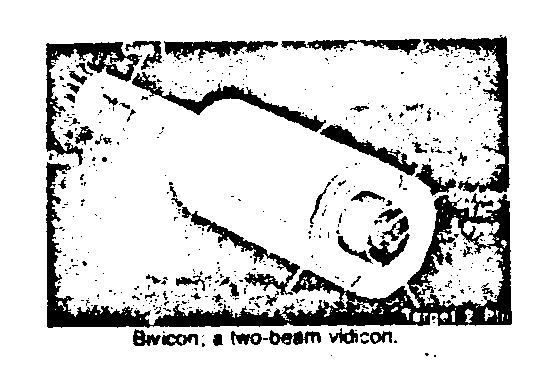
fig.22. the bivicon (tube structure).
evaluation of experimental bivicon cameras in holotape placers revealed; overall frequency response is flat to 4 mhz, laser power of 1 mw incident on holotape produces a good color picture, crosstalk between targets is less than 1%, and frame registration accuracy of 1% can be achieved.
although the bivicon was developed specifically or holotape by rca'a electronic components division, lancaster, pa., it is evident that this new tube will find application elsewhere.
vi. appendix
analysis or background pattern created by randomly phased point sources
consider the situation in which coherent light from a square array of n equally intense (unit magnitude) point sources with equal angular spacings illuminates an object transparency. the light complex field amplitude at the object piano is
 (1)
(1)
where: p is the spatial period of the fundamental, φ
mn is the random phase angle. note that when n randomly phased waves are added the resultant complex field amplitude is given by
r=(cosα
1+cosα2---+cos αx)+j(sinα1+sinα2---sin αn)
and the intensity is
r2=(cos2α1+ cos2α2 ---+cos2αn)+(sin2α1+sin2α2---sin2αn)
+ crossproducts which average to zero because of the random phase. hence r2=n. it follows that tlie average intensity obtained from an array of randomly phased point sources is also uqual to the number ol sources n.
note also that for a square array there will be  beams that can beat together in either the x or the y direction and since these
beams can beat with a neighboring beam on either side, the total number of beat
products is 2
 . thus the intensity
at the object plane can be expressed as
 (2)
(2)
+ (higher order taring that are or no interest).
the second and third •tanna reproaant the summation of randomly phased sinusoidal intencity variations. they may be expressed in the form
 (3)
(3)
because of the random phase relationships this reduces to
 (4)
(4)
this indicates that the sinusoidal intensity variation reaulting from adding n sinusoidally intensity modulated waves is times the intensity modulation of an individual wave.
it follows that eq.(2) can be expressed as
 (5)
(5)
where φ' and φ" are arbitrary phase angles.
signal-to-noise ratio is defined as  .
.
in this case, the average intensity is Ī=n and the nns variation of intensity
 is
is

r e f e r e n c e s
1. h.e.ives. brit.j.photo. 609, august 3, 1906.
2. k.budermann. j.opt.soc.am., 61, 1439, 1971.
3. a.macovski. appl.opt., 11, 416, feb. 197'2.
4. g.braudt. appl.opt., 8, 1421, 1969.
5. j.c.urbach and r.w.meier. appl.opt., 8, 2269, 1969.
6. w.t.gathey, jr., j.opt.soc.am., 56, 1167, 1966.
7. r.a.bartolini, w.j.hannan, d.karlsons, and m.lurie. appl.opt., 9, 2283, 1970.
8. t.credelle and f.spong. rca review, 33, march 1972.
9. e.n.leith and j.upatnieks. j.opt.soc.am., 54, 1295, 1964.
10. h.j.gerritsen, w.j.hannan, and e.j.ramberg. appl.opt., 7, 2301, 1968.
11. a.h.firester, e.c.fox, t.e.gayeski, w.j.hannan and m.lurie. rca review, 33, march 1972.
12. c.kittel. introduction to solid state physics, (john walley and sons, inc., new york 1953) third edition, chap.2, p.52.
13. p.c.goldmark. "color electronic video recording", j.smpte, vol.79, p.677, aug.1970.

