analogical methods por the processing of optical information*
jean-charles vienot
university of basancon. faculté des sciances et des
techniques, france
i n t r o d u c t i o n
the determination of the specific information in a message has proved of interest in data processing in general, and particularly in coding. in this respect, holographic techniques represent an important stage as far as any selection of information is concerned. besides, simple conciderations about the definition of optical data have grown into several groups of processing methods. some general concepts are recalled in fig.1.
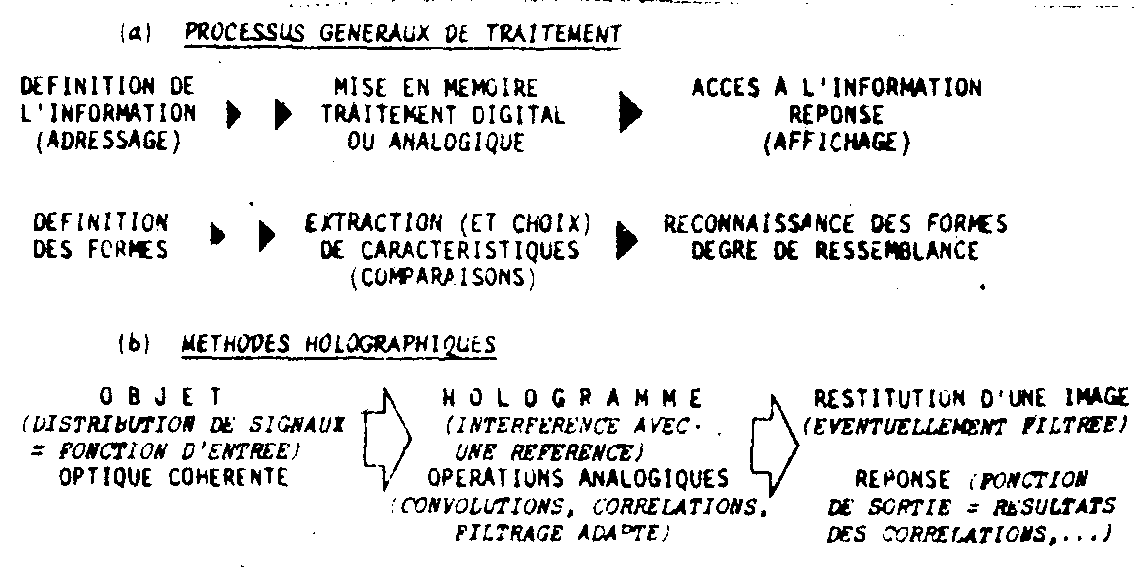
fig.1. general scheme of processing and use of the holographic techniques to process optica data.
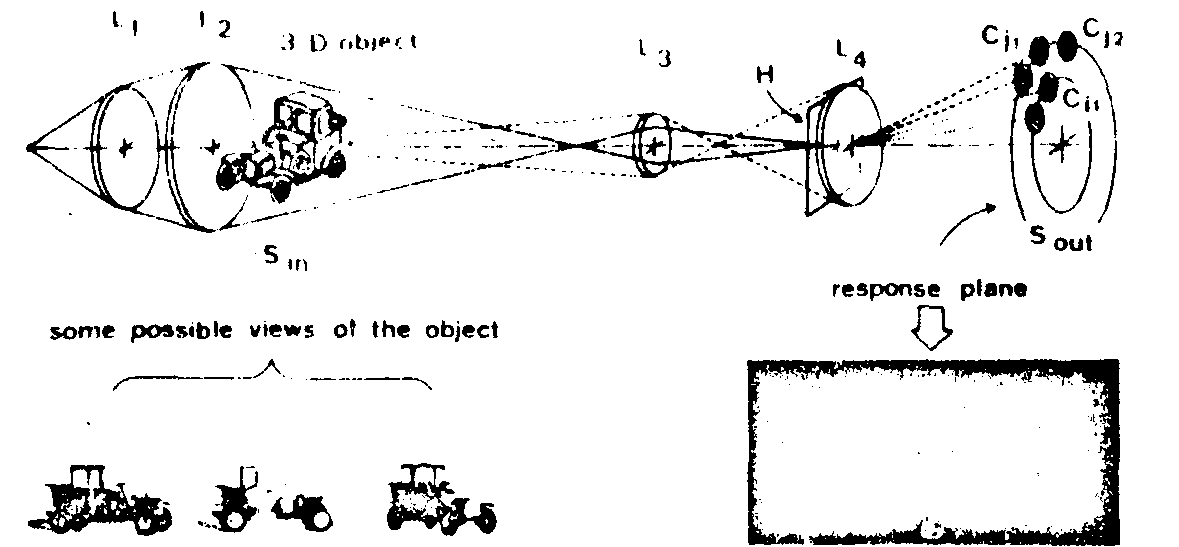
fig.2. particular configuration of an optical correlator in the case of three dimensional input objects (afterreference /1/). the brightest spot in the output plane indicates the type and orientation of the entrance signal sin.
a well known pattern recognition method is shown in fig.2. it consists in matching a spatial filter (fourier hologram h) with particular features of the input (sin), in the fourier plane of a correlator. the matched filter is usually a fourier hologram and one has to carry out particular configurations of the practical device, according to the type on information to be processed. an illustration in the case of 3d pattern recognition is then given and the situation can be summarized as follows. assuming matching with main characteristic frequency bands of signals is strictly carried out, high selectivity multiple filters can be made in order to process complex input at one time, containing several fidderent signals non necessary identical.
conditions:
1. matching of the pass-band fh-filter: non general law;
2. choice of specific bands according to input function;
3. several frequency regions are necessary if several input signals
3d pattern recognition
reconstruction of images "spectrally" modified,
coding (carrier = random grid).
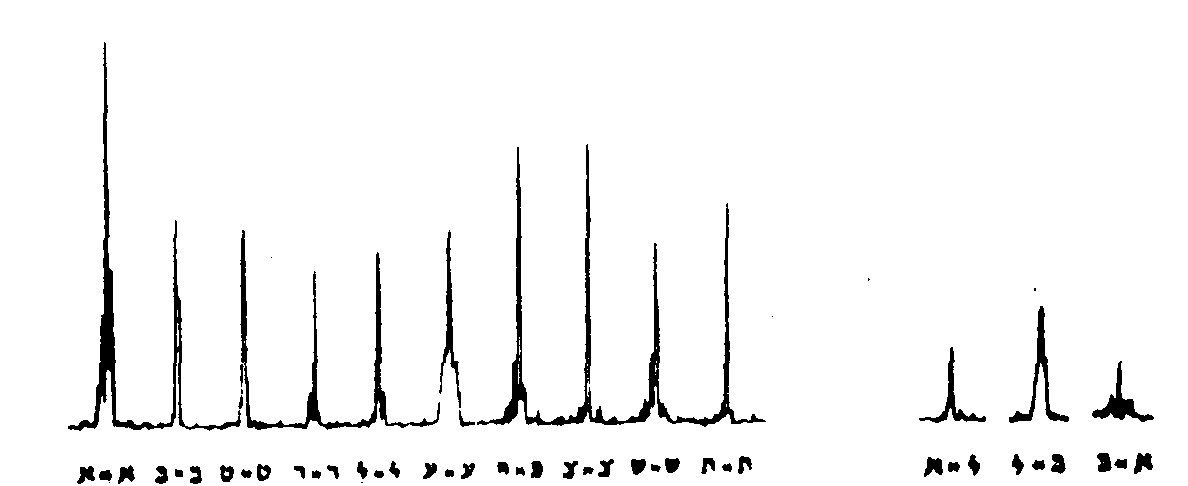
fig.3. responses given by an optical correlator in the measurement of the degrees of resemblance of hebraic letters: photometric profiles of the autocorrelation (on left) and cross-correlation signals (on right).
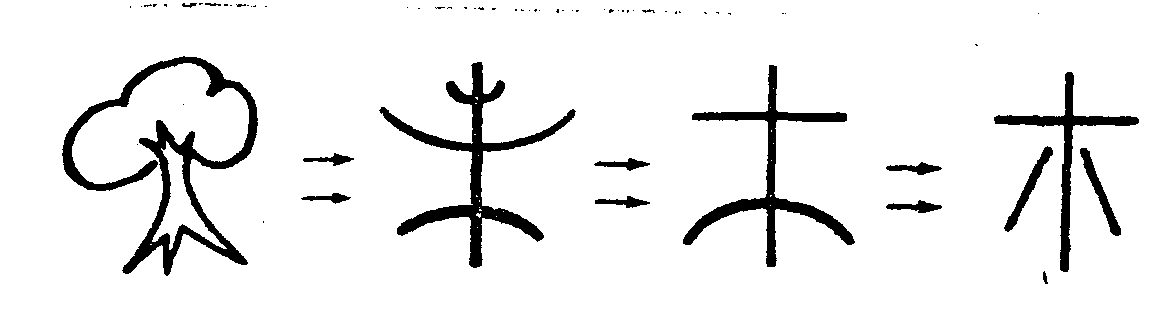
fig.4. evolution in the graphic representation of a tree:
from the schematic drawing (left) to the modern japanese ideogram (right).
the use of several carriers - or coding references - can be applied in multiplex techniques to the discrimination of optical signals, such as group of letters, both on recording and retrieving. an another example fig.3 is a chart of the autocorrelation and cross-correlation profiles which are obtained at the output, of a correlator as one studies hebrew letters in ancient manuscripta. the same technique also applied as one seeks for the gradual changes in witting a language: for instance fig.4 suggests that a degree of ressemblance between japanese ideograms representing a tree, and drawn at various times can be made.
but let's proceed now to a more general discussion.
so, facing the problem of optical information processing one immediately thinks of reducing the number and complexity of operations to be performed. for the some reason of economy, it is necessary to take into account the limited capacity of operational elements at any intermediate stage (e.g. storage capacity of an optical memory). therefore, a primary concern is the choice of particular features of the message and the starting point will be to recall the concept of characteristic spectral bands in order to find out methods how to determine the useful information in a message and increase storage capacity as well as transmission density. the importance of the properties of the carrier will also be demonstrated through examples.
in the 1st group of methods corresponding to these concepts we consider the choice of specific data, information grasping and compression of information.
occurence of specific bands in a spectrum
fig.5 illustrates a quite intuitive fact: the description of any object does not demand the knowledge of its complete spect-
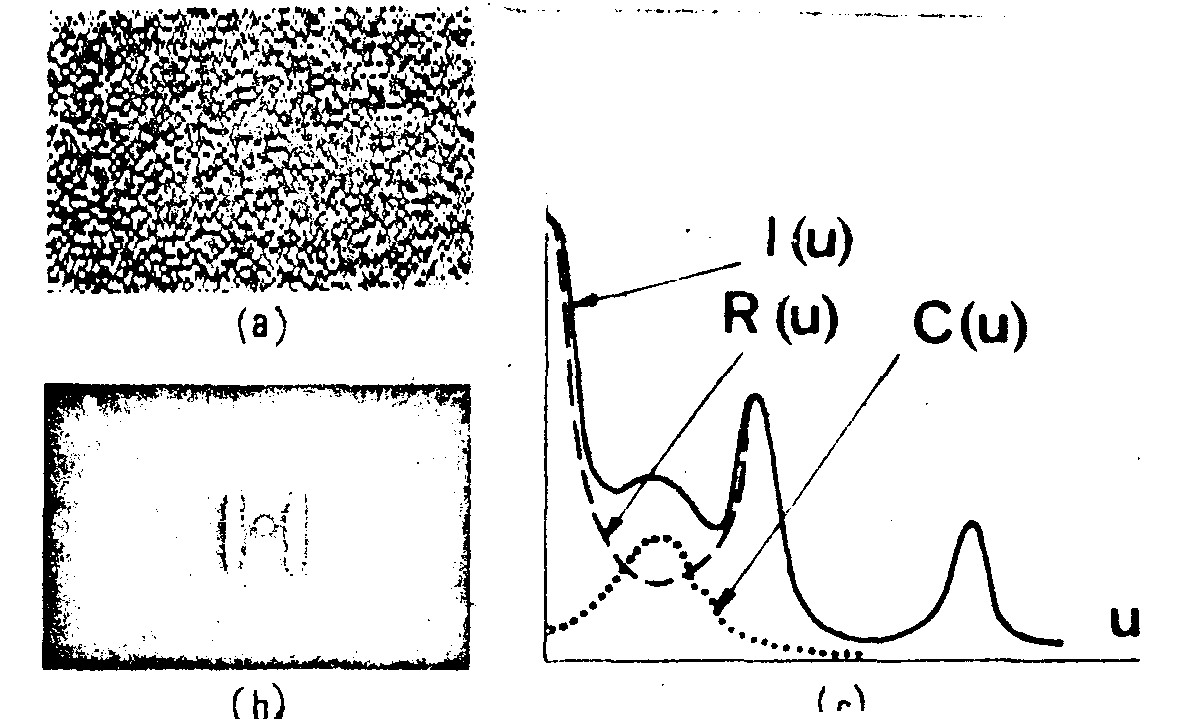
fig.5. characteristic frequency band of an amplitude grid.
(a)part of the grid(pseudo-random distribution), (b)its fourier spectrum whose photometric section (c) can be considered as the sum of recurrent and characteristic parts, r(u) and c(u) respectively.
rum. in this occurence we can benefit from privileged parts of the spectrum while others can be pruned. this results in a reduction of the occupancy in the fourier plane. our example refers to information transfer by holography. it shows photo . -graphs of a pseudo-random grid (sometimes used as & grid-source in spectrometers) and of its diffraction spectrum. the latter clearly indicates that the spatial frequency bands are quite narrow. the photometric profiles, i(u), can easily be considered as the supposition of two terms, r(u) and c(u). the recurrent component r(u) corresponds to main periodicity. c(u) characterizes the pattern in the sense where it denotes the' departure from periodic distribution. to some extent it can be said that b(u) describes redundancy with respect to specific information c(u). advantage is taken out of this in coding! for instance, let us record the fourier hologram of the text (fig.6) with our pseudo-random distribution as reference source( the relative importance of the lateral bands in the carrier spectrum - that shown in the previous figure - suffices to 'code' the message which is in turn recovered by conventional reconstruction process. the legibility of the reconstructed text, is reasonable although its spectrum contains frequences in a limited range.
fig.6. the grid of fig.1 is used as reference source in recording a fourier hologram of the text on left, then as reconstruction source for retrieval of the Image displayed on right. loss of information is small although the carrier frequency band is strongly limited.
geometrical compression of information
now, the existence of the lateral bands corresponding to c(u) in the spectrum we just discussed - suggests to pinch the information liable to modulate such a carrier in narrow regions situated near the center in a diffraction plane (that can be a hologram plane). this is sketched in fig.7 where we deal with sphere-cylindrical systems whose properties allow to work with one direction at one time. in particular if one chooses a combination of lenses sc, such as the y-direction and i(u)-plane (fourier plane) be geometrically conjugated, all the information contained in the aperture (x,y) is then Imaged along the y' - line (according to sphero-cylindrical optics). therefore the information is compressed in the vicinity of the y' axis. suppose now that an extended aperture is placed in the same plane as a text-object, both of them being coherently illuminated. a fourier-hologram can be recorded in the i(u) plane. this compression technique is applied to a printed text (fig.8). in (a) the lines of
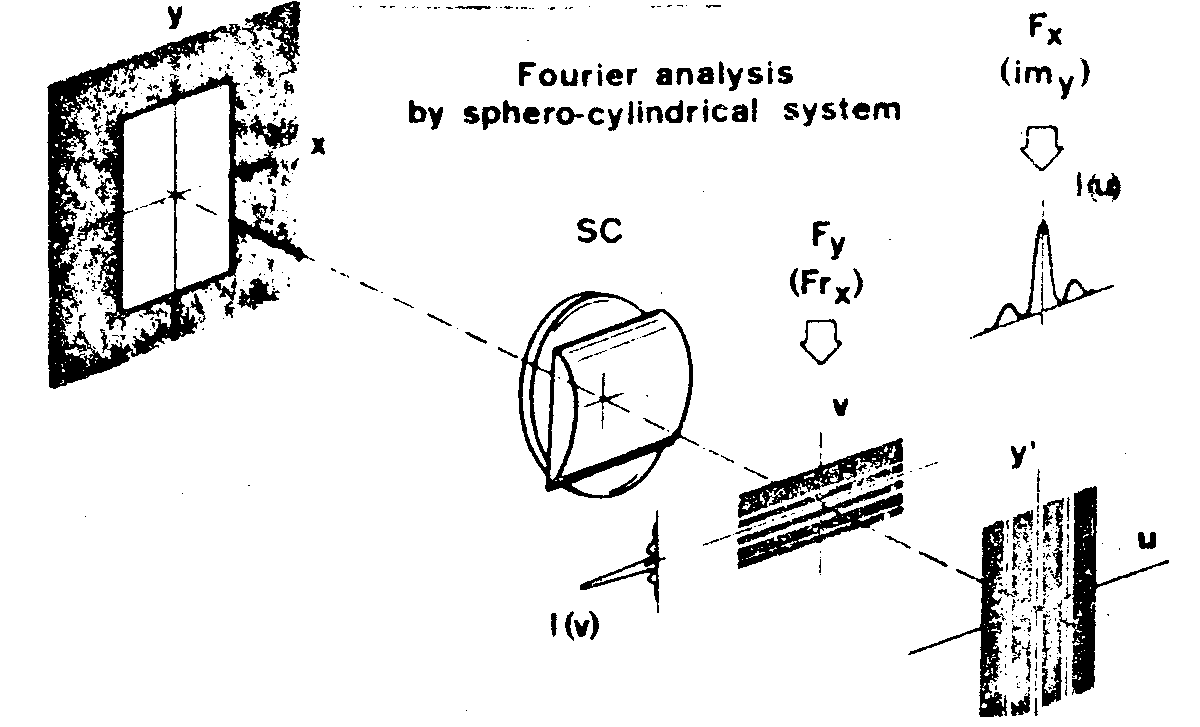
fig.7. one dimensional fourier analysis. any sphero-cylindrical system yields fourier spectra i(u) and i(v) corresponding to x- and y-directions respectively. in the situation sketched here, sc images the aperture (x,y) along the y' direction of the i(u) plane.
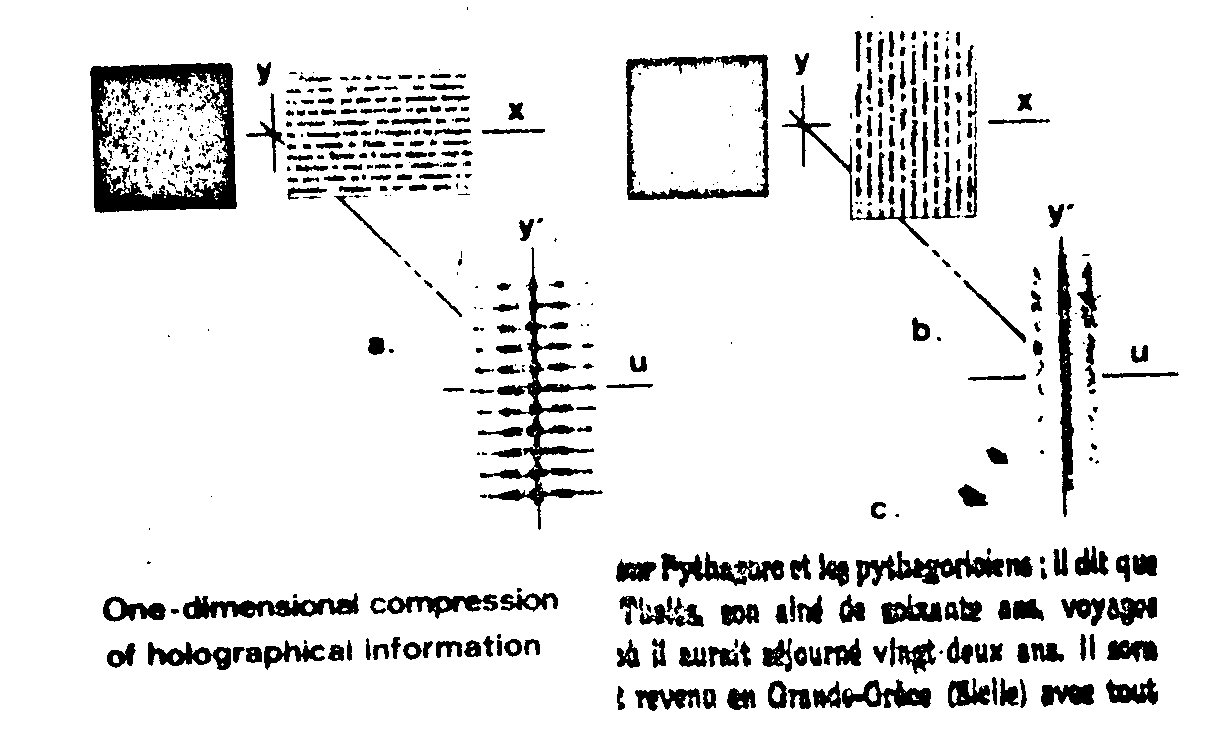
fig.8. illustration of one-dimensional compression.the fourier holograms (a) and (b) of the same text are recorded, with an extended square aperture as reference source, in the i(u)-plane of a sphero-cylindricsal objective (not represented in the diagram), for 2 different orientations of the lines. as these are parallel with y-direction previously considered, the compression is optimum and the reconstructed Image (c) of satisfactory quality.
the text being orthogonal to y'-axis, the carrier assumes the modulation of a small area in the spectral domain: the amount of stored information cannot be large and the reconstructed Image would be of poor quality. the situation is more favourable in (b) since the sphero-cylindrical objective works line by line both as a one- dimensional ft-operator (x→u) and ideal imaging system (y→y'), (as far as isoplanetism condition is fulfilled). such an actual achievement in information confining results in the capability of increasing the data content in a holographic plate by diainishing the waste of sensitive surface without seriously damaging the reconstructed Image at bottom. emphasis should then be laid on the
informative value of the reference. this also represents an argument in information coding: for a certain amount of information, the best coding is linked with storage optimization, which is in turn associated to maximum diffraction efflciency /2-4/.
reference matching: as a function of the signal
in split of the interesting properties of information transfer by means of a unique spectral band as discuseed so far, the spectral distribution may considerably vary from one letter to the next, involving a loss of contrast in the reconstructed Image of a text. determination of a suitable spectral band should not proceed from an arbitrary choice. it must match the reference with all individual signals and relative importance of each species. for instance, to process one given page of a text one has to take into account the occurence probability of each letter (weighting function), therefore construct a random distribution of all possible characters, the number of each being proportional to that probability. such a distribution will be used in the reference as well as in the reconstruction source. if we look at fig.9 it shows the visibility of the - fringes as a function of the presence probability of given letters. in the hologram, micro-fringe systems relative to every letter are made to have the same visibility, v(p). thus diffraction efficiency, directly relate d to v(p), will be the same for all letters at reconstruction stage and the overall text linage will be best restored.
attempts to optimize the information in discrete samples
as we tried to choose specific information taken out from redundant description of most message, we now wonder if, under certain conditions, a set of samples would permit to recover the initial function to be processed, still taking into account the nature of the available information. in this information has been arrangeilbeforehand (as it occurs in spectral distributions).,
fig.9. visibility of the micro-fringes on the hologram as a function of presence probability of given letters. in (a) the frequencies nt and nr of any letter in the text and reference are identical; the ratio, k2, of the total number of letters in the reference to the total number of letters in the text is indifferent; (b) is an enlargement of a small region of the computed random distribution (one tenth of the full reference area); in(c) and (d), all the letters are affected by the same weight in the reference: the frequenciea nr of the letters in the reference and nt in the text are then different and micro-fringe visibility depends on k2-ratio.
a regular sampling keeps the resolution in the Image of the same order as that
in the object (after whittaker-shannon theorem). note that a sampling operation of the kind also yields linage replicating. it has proved of interest in the reproduction of small size objects such as microcircuits (see for instance refs./5-7/). if the information offers complete disorder, as in speckles, one tackles an entirely different problem. each grain bears infomati on which concerns the object as a whole and apparently the selection of an ensemble of grains might be performed by means of an arbitrary sampling law - the only condition being to preserve the resolution. we will proceed along two complementary methods, dealing with the two previous concepts.
sampling in the courier plane by amplitude grids
this a well-known technique, illustrated in fig.10.the in-
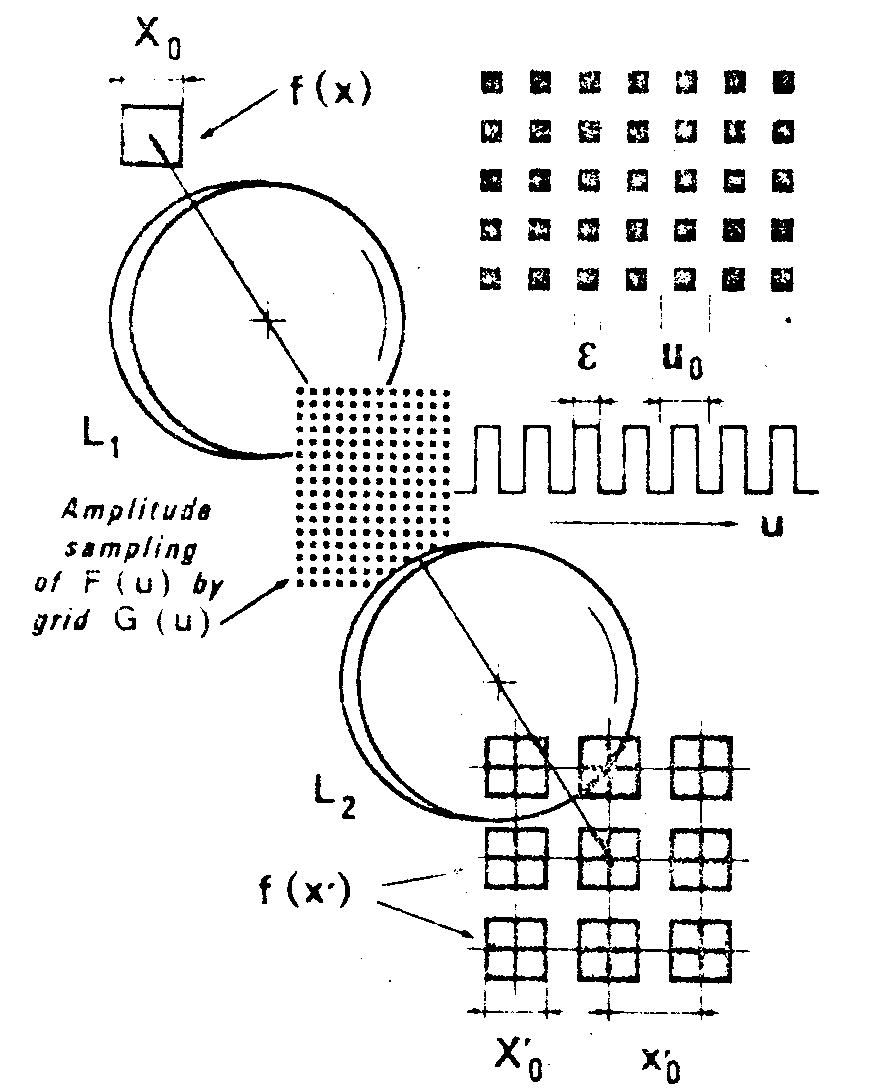
fig.10. priciple of sampling in the fourier plane of an optical correlator.
put f(x) is placed in front of the first lens, l1, of a correlator (l1, l2) which performs a double-diffraction process. the grid function is generally complex. howeever the problem is well defined as sampling is carried out by amplitude grids (g being real and positive), then by pure phase grids, independently. it will be shown that one type of grids comes back tha same effect as the other.
we delete here the theoretical points which can be found in any text book, and just not that as the grid g(u) picks out regions of width about each point u = nuc,
it introduces a modulation term, linked to finite dimension ε, then in turn variations of intensity between central and off-axis images - which is a great disadvantage for duplication.
transposition of amplitude sampling into phase sampling keeps the multiplication property and increases the energy in off-axis images as shown in the following.
sampling by binary phase grids(0-
π)
the black and white (transmittance t=0 and 1) may aloo be considered of transmittance (t = -1 and +1) by an arbitrary translation of the u-axis, and then made to correspond to 0
and π phases respectively.
most techniques bring phase changes back to thicknesa variations of a transparent material for example refs. /8-14/ our analogical method consists in the simulation of a phase grating (fig.11) by filling each element of the checker-board model with a fringe-like set (actually thin opaque lines on transparent background). each set is translated by half-period with respect to its neighbours (a.precise positionning is required). in the reciprocal domain the resulting phenomena represent two superim-posed patterns; one due to the ensemble of all sub-elements(lines), the other to the periodic distribution of fringe , - like sets. schematically the situation can be summarieed as follows:
- the theory is still valid. the 'fringes' behave as a car-
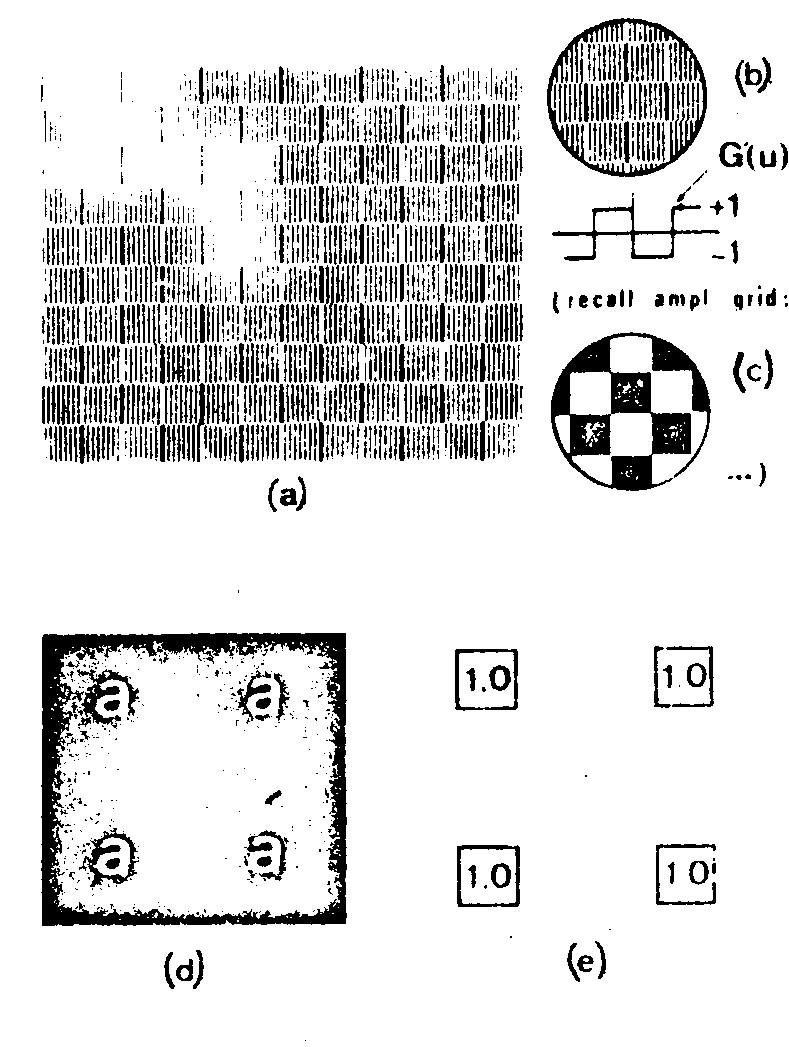
fig.11.
phase sampling by 0-π grid: intensities in 1st-order images, (a) actual 0-π phase sampling grid; (b), (c): simulated transmittance and comparison with corresponding checkerboard model; (d), (e): images and intensity distribution in the response plane.
rier, hence associate several diffraction orders (±1 should they be sinusoidal) to any signal (in the present case f(u) may be considered aa the signal);
- the sampling theorem applies as before, with the same periodicity uo, independently of the 'fringes' which stand for relative phase-shift only;
- one might wonder at the absence of Image in the center of each lateral order since the successive sets (0 and
π phases) have the same width, uo/2, as in the case of amplitude grids: the general pattern should be similar. as a matter of fact, the section of the grid g'(u) being an odd function, the central term of the fourier series is zero. it also happens that the sign of the phase alternatively changes along both orthogonal dircotions of axis. consequently the energy keeps constant zero value where the phases of components are opposite and images located in the corresponding regions of the output plane vanish: one observes the four remaining images on the bisectors. moreover their intensities are similar.
composed phase-step grids, rigorous treatment
we have seen that with the 0-π model the central images get lost as their intensities ought to be the highest. one may ask for an intermediate possibility of sampling which, applied to our distribution, would bring out nine images.
a compromise can avoid privileged directions to prejudice any other. by using fringe-like sets of unequal heights and widths (as far as successive horizontal bands in the sampling model are concerned) a good balance can be expected between intensities in various images. for instance, the configuration reproduced in fig.12 allows to display nine images whose intensities have practically equal values. basic theory starts from two remarks:
(i) the number of images increases as the samples gn(u) pack closer and closer (i,e. as sampling period, uo, decreases); correlatively there is an increase of resolution since one tends to complete recovery;
(ii) a much more elaborated design of the patch-work should permit to ajust both intensities in the Image and final resolution: this is achieved with several different heights of rows, in each row several different widths of sets are used. such a device represents a step-by-step phase variation sampling. the analytical formulation is given from fig.13.
let g''(u) be the complex sampling grid consisting in posi -
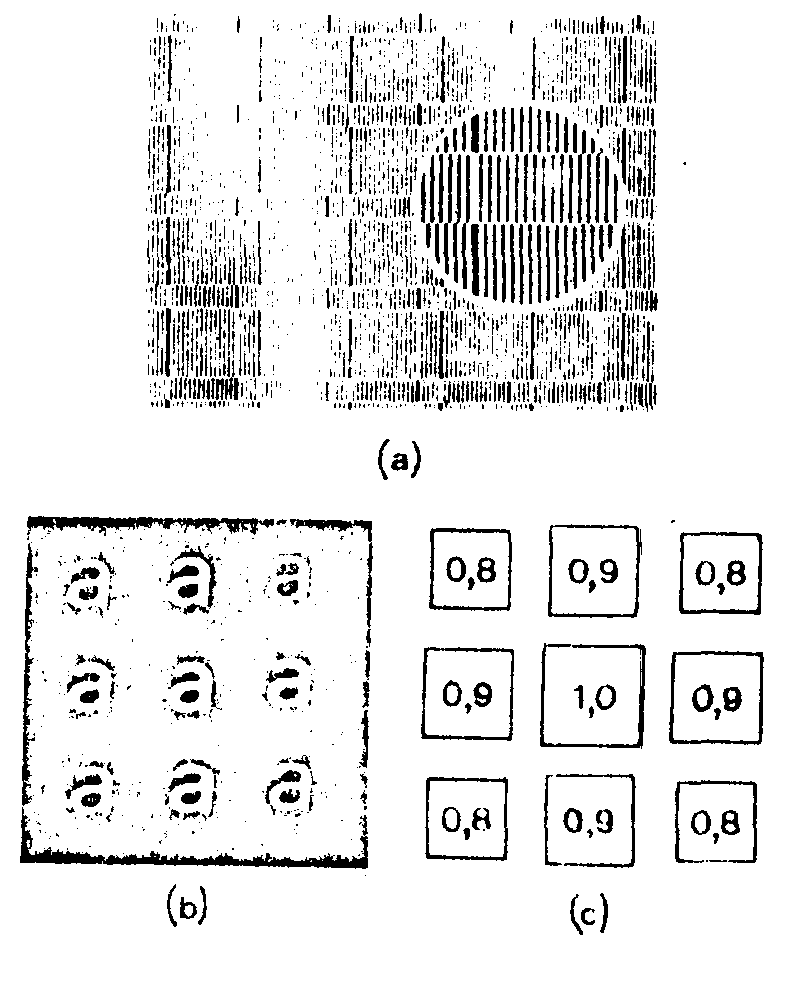
fig.12. improvement of qualities of a phase-grid by composed patch-work. (a) part of the grid with enlargement of a small region; (b), (c): images in central lobe and their intensities.
tive and negative parts of widths kiuo. the relation:
Σk
iu
o=u
o/2
appears as a weighting equation.
from the assumptions it follows that this equation rules the relative importance of positive and negative parts of g''(u), which behave as amplitude transmittance t' = +1 and t' = -1 respectively. besides, energy in various replicated images directly depends on the magnitude of fourier coefficients of g''(u) which are in turn related to the distribution defined by the weighting equation.
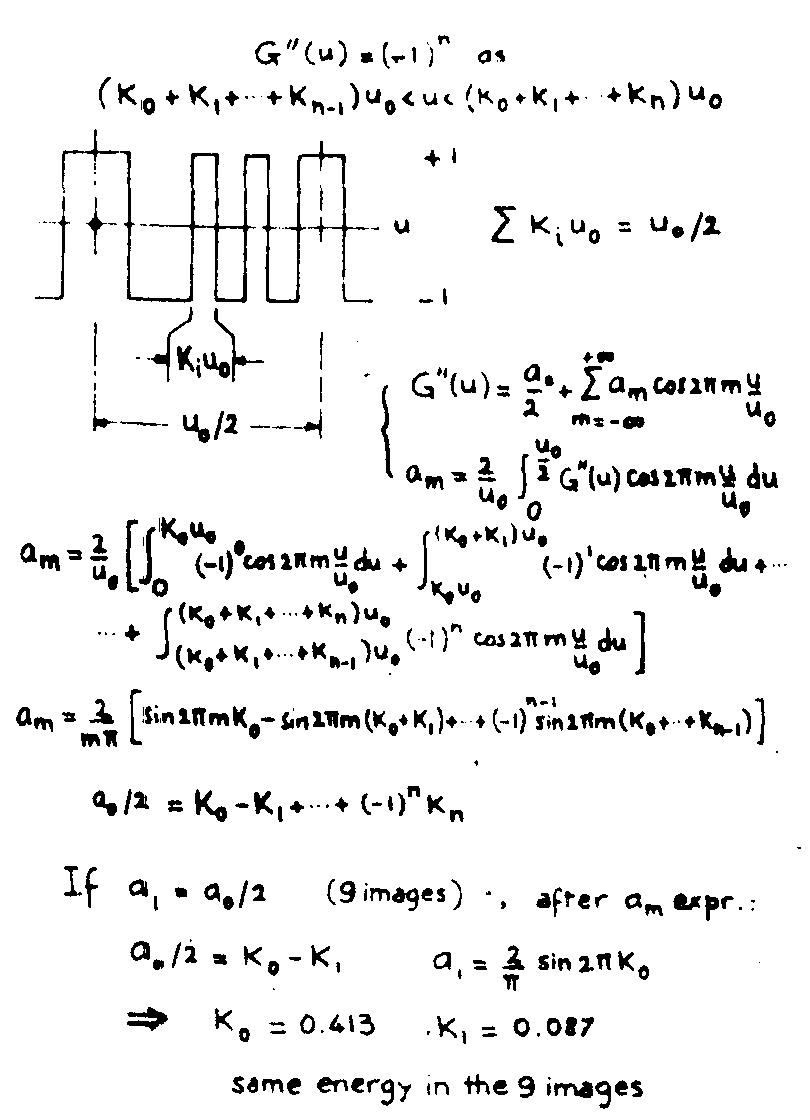
fig.13. principle of calculation of a phase-grid.
finally we dispose of n independent parameters, ko, k1,…,kn-1 (the last one, kn, is fixed by the weighting equation. we then have (n+1) independent relationships which in turn determine the first (n+1) fourier coefficients.
conversely given values being assigned to the latter - that is to energies in the images - parameters ki, then the grid patterns are deduced, in fact, for a two-dimension model, (2n +1)2 terms including the zero one correspond to n fourier coefficients. so, coming back to the previous representation, we get 9 identical images if a1=ao/2, and computation of ko and k1 starts from the expression of am-coefficient (eq.7 and 8):
a0/2=k0-k1, a1= sin2
k0;
sin2
k0;
them
k0=0,413; k1=0,0087.
for large numbers of images the aid of a computer is necessary.
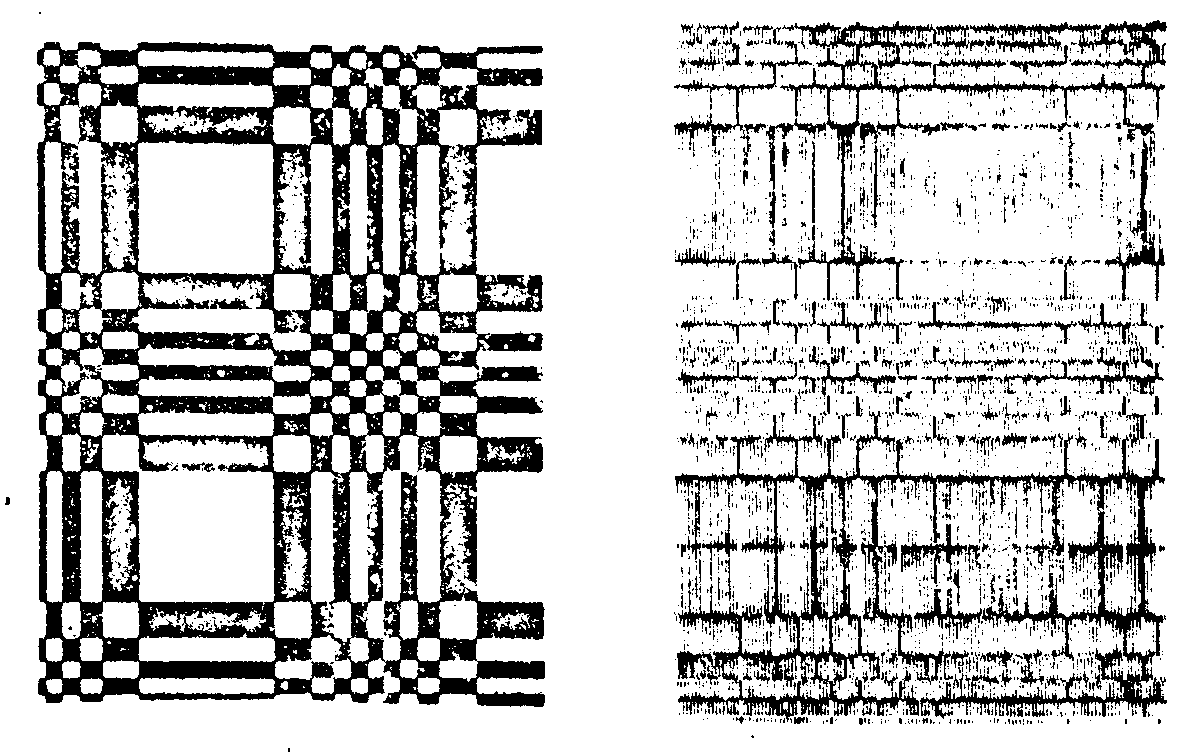
fig.14. amplitude grid (left) and computed phase-grid (right) allowing a multiplication of images by 121.
in fig.14, for example, the phase grid on the right was drawn with a desk machine (it corresponds to the amplitude sampling grid represented on the left and. corresponding to an Image multiplication by a factor 121). that phase grid yields the same number of images of identical intensities. indeed we are now developping a purely optical method, avoiding any computer, to make such grids.
random sampling in the wave-front
tho problem of sampling a speckle consists of recording a number of independent small holograms in one plate. the main advanta-
ge is also to gather several sets of such holograms which lead to comparable Image resolution, each set being independent of ths others. we have used that method in dynamic hologram interferometry but among other applications let's quote the study of 3d object general movements and, most important, the approach to the reduction of speckle effects in reconstructed wave-fronts, namely in the problem of the holocamera endeavoured by the nasa: we think that improvement of Image quality can be achieved by coherent reconstruction of time-incoherent juxtaposed holograms obtained by means of random interlaced distributions of samples.
averaging processes
simple forms of optical avarages
considering now a set of signals, we aim at defining some average signal, as the elements of the set reveal large similabities in shape and structure. should the elements look slightly different yet belong to a given class - for instance series of portraits, hand-written individual letters in a text, etc. - one may seek for common parts (characteristic lines, pot-hooks) that must be found out from one signal to the next. in any case, the attainment of an average geometrical shape is performed through the average spectrum of the signal set. the present method simultaneously yields geometrical superimposition of input signals and coincidence of their spectra. one deals with average fourier holograms, wherefrom information keeps available for further processing. eventually, from a set of signals, that are supposed to convey similar information, one can demonstrate the possibility to build up:
the average signal,
the average spectrum of the signals (or the average ph), in one experiment. this is achieved by means of a double diffraction setting (fig.15). the superposition of individual spectra of signals recorded on a photographic plate constitutes the input. the output easily shows as the average modulus of the spectrum.
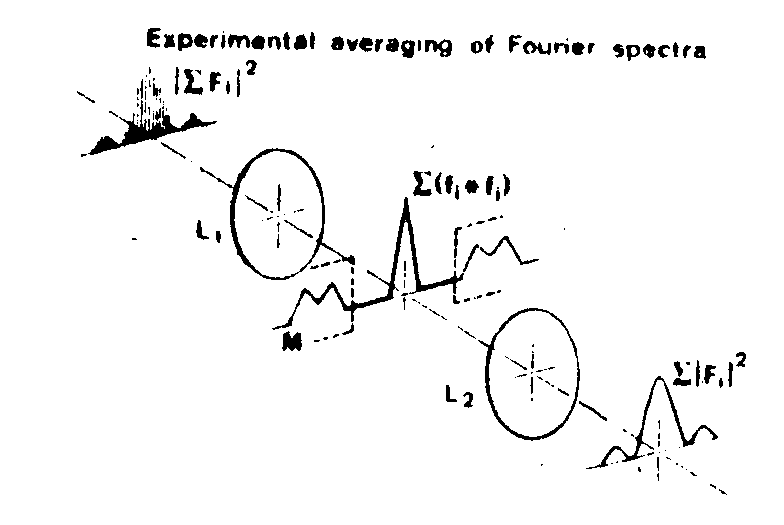
fig.15. various steps in experimental averaging of courier spectra. a photograph of the set spectrum is taken as the input of the correlator. l1, l2 are lenses, the mask m isolates the autocorrelation term. the average spectrum is displayed in the output plane.
unfortunately, the signal appears in the autocorrelation fi * fi only, that is as an average energy. geophyeiciste readily use such technique /15/ in the determination of autocorrelations and main periodicities of seismic signals. we thought that a new approach could be the introduction of a reference in the input: such holographical technique not only favours autocorrelation products in the intermediate plane, but also crosscorrelations between signals and references (once conveniently chosen). these latter ternie are automatically separated and displayed. similarly average fourier-holograns are observed in the output plane.
one then replaces the sure of fourier spectra in the input by a sum of fourier holograms made of pairs such as fi + ri, where the reference ri corresponds to signal fi (fig.16). in the new situation the cross-terms (Ф'ij+Ф'ji) are rejected off-axis in the focal plane, at a sufficient distance to be completely separated from the centered terms.
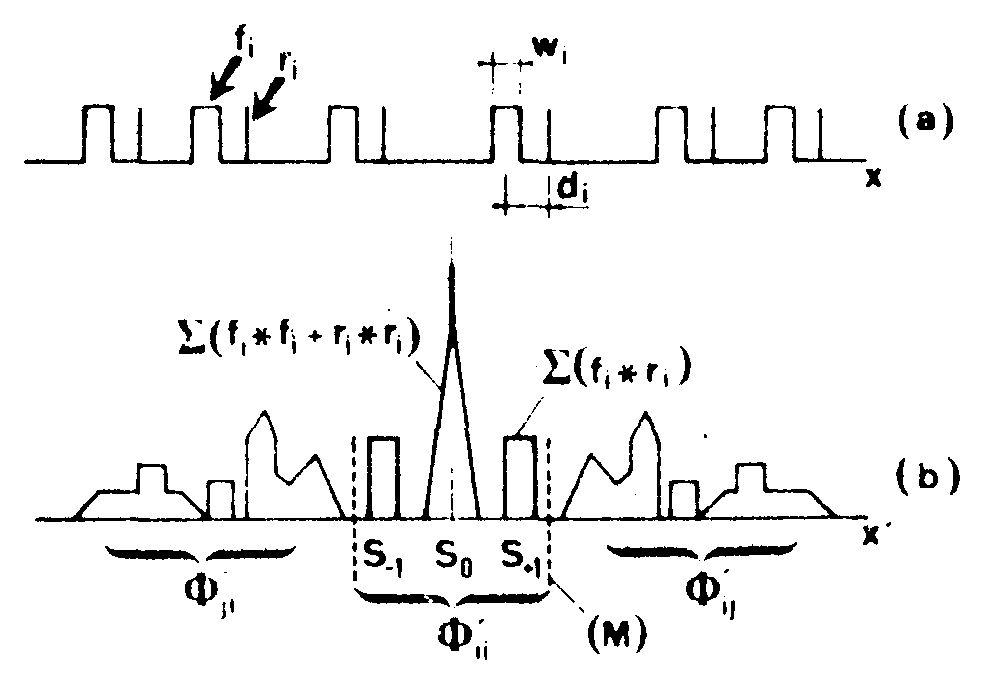
fig.16. graphic representation of the autocorrelation of a set of independent discrete signal-reference pairs; fi: sample, ri: reference. as before, ii represents the autocorrelation term, isolated from the cross-correlation terms Ф'ij, Ф'ji by means of the mask m.
in s0 one finds n-times the autocorrelation Фii of fi, apart from a photometric additive term which increases the central peak intensity. the (+1) and (-1) terns behave as lateral orders of diffraction and actually represent all fi signals devoid of all spreading as long as the references ri are dirac impulses and distances d. between various fi and ri are equal. in that case s+1 is the average geometrical pattern and s-1 its symmetrical Image.
average fourier-holograms
a futher diffraction applied to the central region isolated by a slit-thus to the therm Фii - gives the fourier-transform of s0 + s+1 + s-1, that is n-times the average fourier hologram of an individual input signal.
in this hologram is therefore stored the average geometrical pattern of the signal, that was previously observed in the
fourier-plane of the correlator. the average information' derived from the set of signals can of course be used in anydetection or comparison operation. but it seems of interest to insist on the fact that the quality of the Image reconstructed from the <(fh)i> essentially depends on the location of references ri: the Image resolution is strongly related to the spatial frequency of the interference pattern (fi, ri) which acts as a carrier is determined by the distance di from the reference and the axis of the signal (root-function); di should be greater than the fundamental frequency of the object:
di > wi,
it means that the method applies to sets whose elements stand sufficiently apart from each other to manage enough room for a reference in the free interval between one signal and its close neighbour. if the separation is not large enough, an arbitrary shifting of the signals allowing to fulfil the condition does not affect the information content and structure of the hologram which remain unchanged in any translation of elementary pairs (fi, ri).
experimental results and some applications
results presented in fig.17 deal with block characters (ashkenaze from, ancient hebraic manuscripts); the outlines and patterns of these are rather differcnciated from one to the next and they do not join together. practical experiments had shown the necessity to stick to average outlines obtained from smaller number of characters. the whole process is summarized on the figure. cursive hand-writting appears as the next step if one takes into account the relative ambiguity in possible tracing of any particular letter (mainly due to curved strokes (fig.16). averaging must then be carried out on a large number of samples. a part of one line has been reproduced at the top (beside each letter a vertical bar stands for reference ri - dirac function). such positioning has proved to be well adapted to sphero-cylindrical combinations since those devices simultaneously pro-
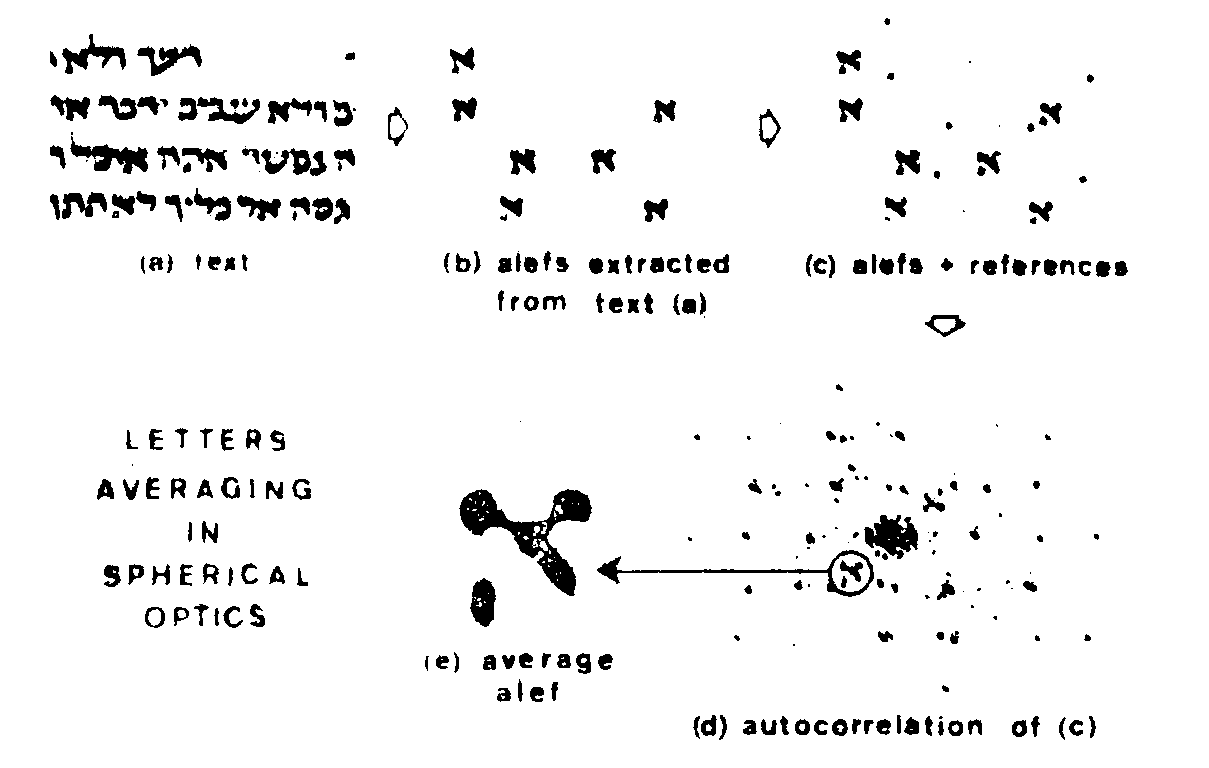
fig.17. holographic construction of an averaged letter (alef) from seven letters extracted from a text. the positions of the reference-points are determined in order to avoid spurious interference phenomena.
cess signal sets line by line. consequently (ph) bums, correlation terms (hence average signals formerly defined), and finally <(fh)i> corresponding to each line are displayed along distinct rows.
the same technique was employed in the assessment of the psychological szondi tests, consisting of series of 48 portraits, six on each line (in fig.19 we have only a part of the set). the portraits in one line refer to faces of patients affected with a typical pathological disease. the application of our averaging method leads to the determination of a common feature in the faces for some lines only. at bottom is represented the correlation for a line bearing the significant feature of an instinct trouble (catatonic schizophrenia). this result

fig.18. holographic averaging of signals f i: (a), (b), (c) stages in the construction of the actual average signal (d) and its average fourier hologram (e).
based upon pattern comparison at least suggests there is no unrestricted psychological morphology. hefining of some criteria might be hoped by improvments still in progress.
anyhow a larger extension encountered practical difficulties. it was then suggested to define an invariant quantity for a given get of signals of one kind. this is the case in hand-witting: the probability of presence of each letter in a given language is known. one nay also draw standard letters of an alphabet as a model. an invariant will identify the scribe with morphological features of his writting/16-18/. it is shown that invariants can be derived from succesaive correlations, relevant terms being isolated as a suitable mask is disposed in a plane reciprocal to that of the message power spe-
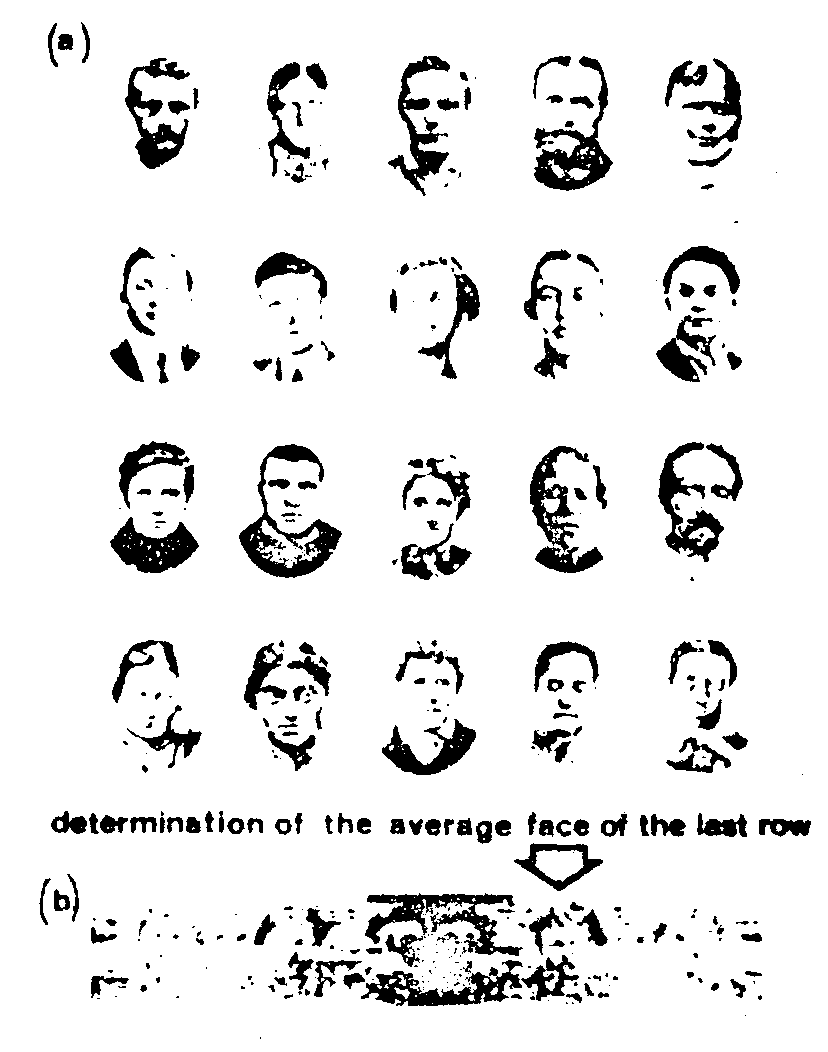
fig.19. application of holographic averaging to the appraisal of szondi test (a); average portraits, as that in (b), lay stress on particular feature of faces.
drum taken as input function. i illustrate this with two ancient latin manuscripts (fig.20) where, by comparison between the invariants corresponding to the writings, musical notes and complete texts, we were able to say that the notes were drawn by the same monk, whereas the speeches were written by different scribes, at different places.
c o n c l u s i o n
optical data processing may be considered from various points of view. we faced it rather as a technique than a logic,
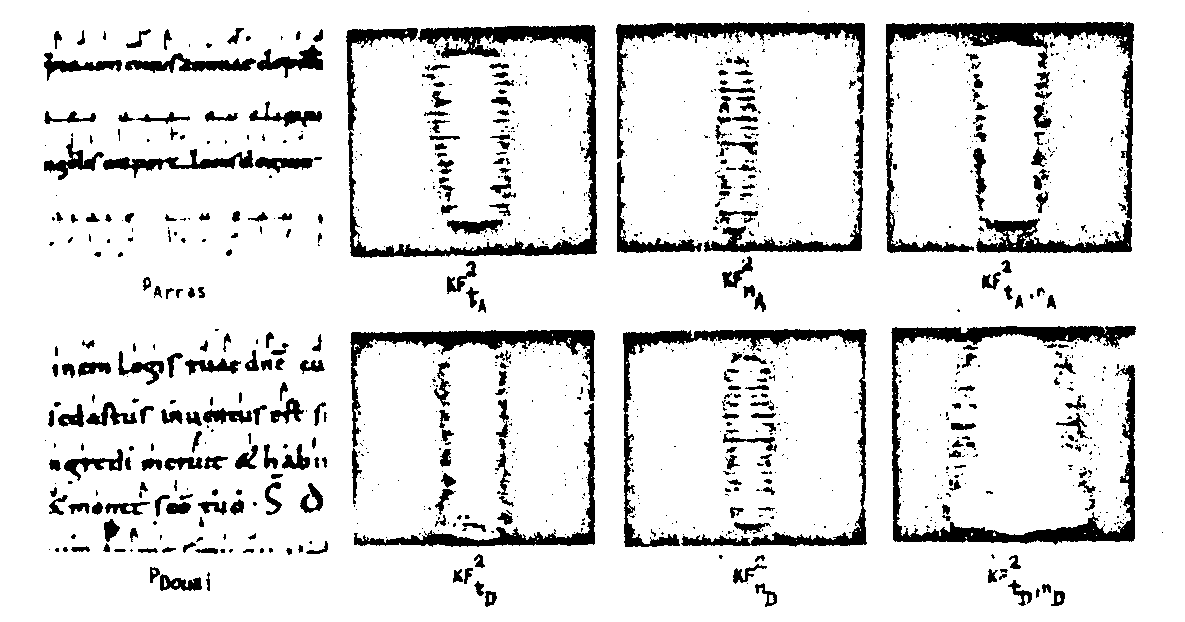
fig.20. any drawing of a letter is considered as the reeult of the convolution of a model by a function which characterizes the scribe. the fourier spectrum, f, of the latter is then determined for the text and for the associated musical notes independently. this makes easy any comparison between manuscripts whose parts aro eventually written by various persons (see refs.17.18).
along different ways summarieed into the present provisional lonolusion. in the first part it has been recalled that holographic recording being a processing in itself, convenient matching of the reference with some characteristic bands of the message spectrum together with cutting down redundancies led to compression either in the fourier space or else in the geometrical domain with the aid of sphero-cylindrical systems. the sampling techniques, discussed in the second part, also lead to reducing necessary space to the description of the information while preserving its apecificity as far as sampling law fits. furthermore it has been noted that relashionships could be derived from phase sampling concepts which permit to balance the intensities of the various images at leisure. each intermediate Image rocking possible separate
processing, applications of random sampling have proved to be of great importance. in the third part average signals, power spectra and fourier holograms have been worked out. such average representations appear as a simpification of input signals for further processing or results of processings themselves. the given examples intended to illustrate our speculations, but were limitative by no means.
r e f e r e n c e s
1. j.oh.viénot, j.bulabois, l.r.guy. three dimensional object recognition in real time by multiplex spatial filtering. opt.comm., v.2, p.431-434, 1971.
2. j.ch.viénot, j.duvernoy, q.tribillon. problémes du traitement optique de l'information. nlle rev.d'optique, v.2, p.269-278, 1971.
3. j.bulabois, a.caron, j.ch.viénot. selectivity of hologram. filters as a function of pass-band characteristics. opt.tech., v.1, p.125-141, 1969.
4. g.tribillon, j.ch.viénot. discrimination of optical signals by using random distributions of sources in fourier holography. opt.comm., v.3, p.165-168,1971.
5. r.m.bracewell. the fourier transform and its applications. mc craw-hill, 1965.
6. y.w.lee. statistical theory communication. john willey & sons, inc., 1966.
7. s.c.som. multiple reproduction by sampling, j.o.s.a., v.60, p.1628-1634, 1970.
8. h.daniman, k.görtler. high-efficiency in line multiple imaging by means of multiple phase holograms.opt, comm., v.3, p.312-316, 1971.
9. l.b.lesem, p.m.hirsch, j.a.jordan. the kinoform: a new wave-front reconstruction device, i.b.m., j.res. develop., v.13, p.150-155. 1969.
10. h.j.caufield. wave-front multiplexing by holography. appl. opt., v.9, p.1218-1219, 1970.
11. d.h.close. contract hugues res.lab.malibu/nasw-2092, 1970.
12. d.armitage, a.w.lohmann. theta modulation in optics. appl. opt., v.4, p.399-403, 1965.
13. a.vander lugt. practical considerations for the use of spatial carrier frequency filters. appl.opt., v.5,
p.1760. 1966.
14. j.oh.viénot. contract lab.opt. besancon/d.r.m.e. paris n° 34003-75-01, 1967.
15. j.e.rau. detection of differencies in real distribution, j.o.s.a., v.56, p.1490-1494,1966.
16. j.ch.viénot. optical information proceeding applied to the study of hebraic manuscripts. proceedings of the 5th world jewish studies congress, jerusalem, 1969.
17. j.m.fournier et j.ch.viénot. mesures sur des traces de let-trcs au moyen de techniques holographiques. coll.int.gnrs paléographie hébraique médiévale & coil. int. gnrs techniques de laboratoire dans l'etude des manuscripts, paris, sept. 1972 (publ. in actes du colloque, cnrs, paris, 1973).
18. j.duvernoy. extraction d'invariants morphologiques d'une information par correlation optique et filtrage spatial. opt.coinm., march-april 1973.


