isophotes amd enhancement of phase sensitivity through optical filtering in image holography.
j.schwider (ddb)
each hologram constitutes at the same time an interferogram and vice versa. here we consider only interferograma or image holograms.
the object is shaply imaged on the hologram plane. tne intenzity distribution of such an interferogram is both graphically and mathematic ally shown in fig.1.
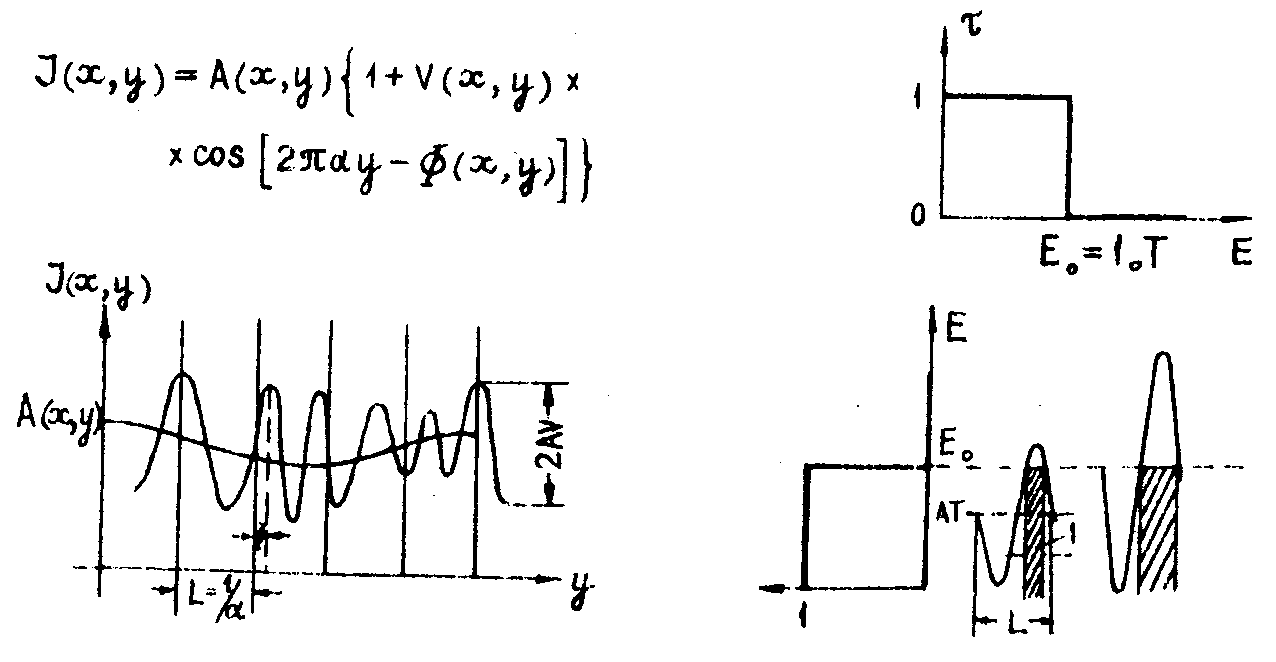
fig.1. fig.2.
it has the usual form:
capital a(x,y) being the mean intensity, v(x,y)-the visibility,
(x,
y) are the phase deviations and α is the carrier frequency. below an example is given for explanation. the deviations Ø are deviations from an equally - spaced and parallel fizeau pattern.
this distribution is printed on a photographic emulsion with a hard-limiter characberistic (fig.2). through this procedure we have received a transparency with an alternating transparent and opaque regions. the width of those regions is mainly modulated by the mean intensity a(x,y).
beyond the swith exposure the transparency has the zero value. in this region the hard print is opaque. let us now consider the phase behavior of the nonlinear print. in the following we put v(x,y)=l and a(x,y)=const. the mathematical analysis of such a meander profile yields harmonics of the carrier frequency
α.
in fig.5 fourier series approach for t(x,y) is given with the coefficients cν . these coefficients are split into a phase term and an amplitude term.
for the present we neglect the amplitude term and consider only the phase term which
contains the phase deviations of the initial interferograir ν-times as sensitive. further the phase-functions for cν and c-ν, are the conjugate complex to each other.
this enables us to perform enhancement experiments for the phase deviation Ø (x,y).
a double diffraction apparatus constitutes an optical analogue computer for the fourier-analysis /1/. therefore we put the hard print into the object plane and in the back focal plane we
obtain the coefficients c
ν. now we let pass cν y and c-ν through two windows in the fourier plane and obtain a total amplitude t±ν as shown in fig.3. if we record the intensity (t±ν)2.
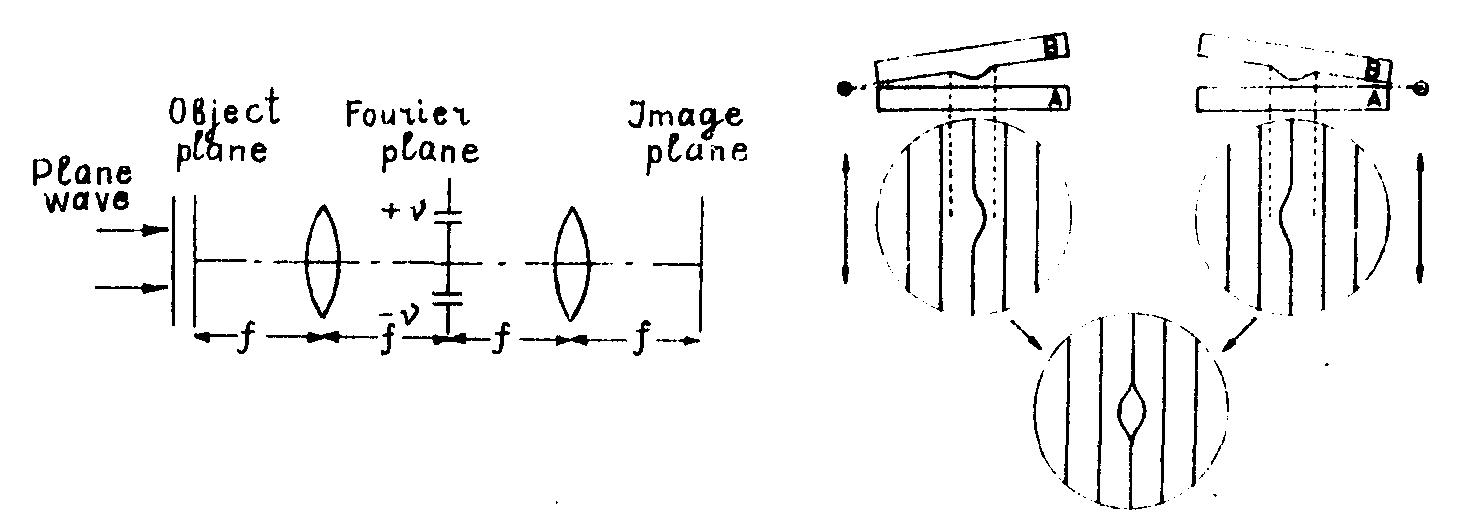
fig.5. fig.4.
then we get the carrier frequency
2να and the phase deviation 2νØ(x,y).
the disadvantage of this filtered interferogram is the high carrier frequency. this difficulty can be overcome by moire-transformations either by a normal grating as done by bryngdahl /2/ or by using a second interferogram of the same object. as an example we take a fizeau-interferometer for a planeness test (see fig.4). we suppose the plates as flat, apart from a small region on one plate. now we make two interferograms with inversed wedge positions and an equal carrier frequency
α. the moire-picture formed by both interferograms has two times the sensitivity of a single interferogram.
if both interferograms undergo the filtering process, geo-
metric-optical distortions caused by the filtering apparatus can be eliminated through the moire-transformation.
the result of this procedure is shown in fig.5. here
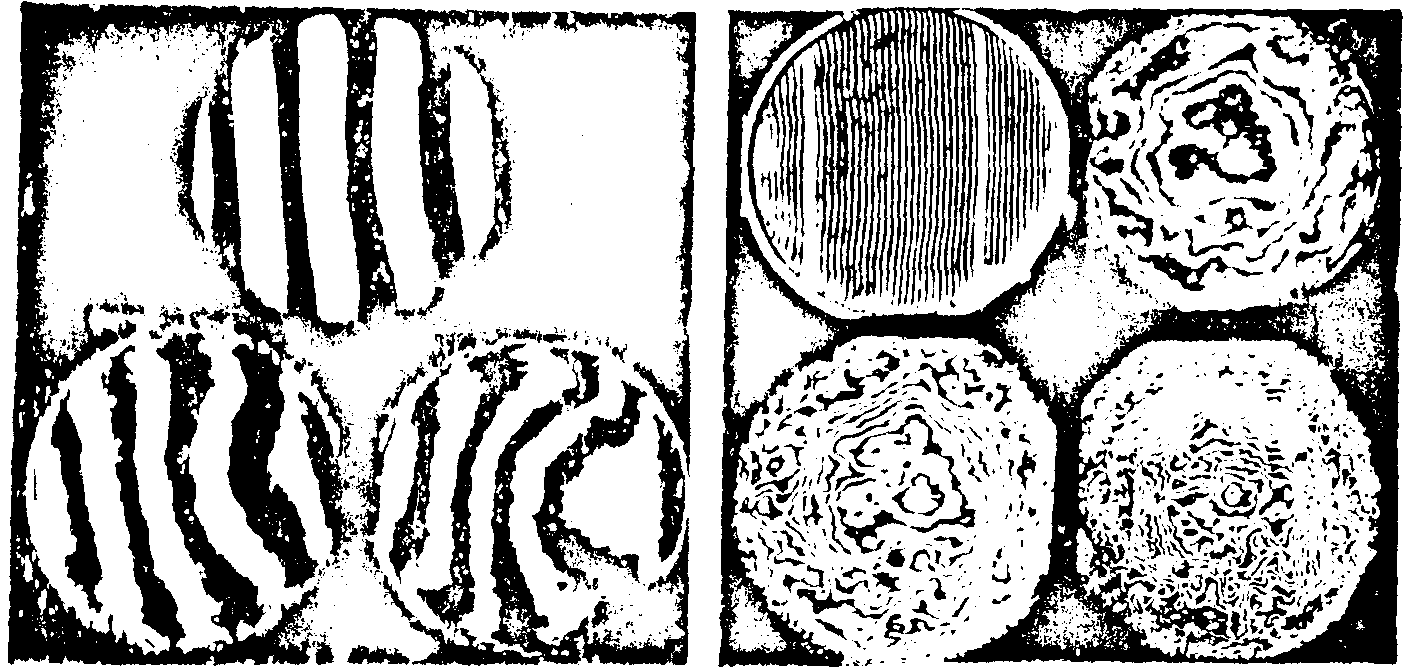
fig.5. fig.6.
two stages of sensitivity λ/8 and λ /16 are compared with a norfial interferograin of λ /2 -sensitivity.
there are cases in which the printing the interferogram on a hart limiter is out of the question. if the visibility of the initial interferograin is weak then each photographic emulsion works nearly linearly and there are do harmonics of the original carrier-frequency. then the repeated filtering in the ± first order yields an enhancement of 2n when n steps are performed.
in pig.6 the initial interferogram was a multiple-wavelength interferogram with a
λ/50-fringe separation. such interferograms can be obtained by an apparatus /3/. the subdivision of the λ/2-step is indicated by the bright fringes within the λ/2-range. the follow-
ing pictures constitute 5 stagea of the ± first order filtering. the adju
stment of the fringes was controlled by a moire-test and the result is the nearly parallel cut or interference "contrast". the sensitivities are λ/200, λ/400, λ/800.
now we return to the amplitude effects caused by a nonuniform illumination a(x,y). in this case the width of the oraque or transparent regions depends on a(x,y). in fig.7 c
ν are
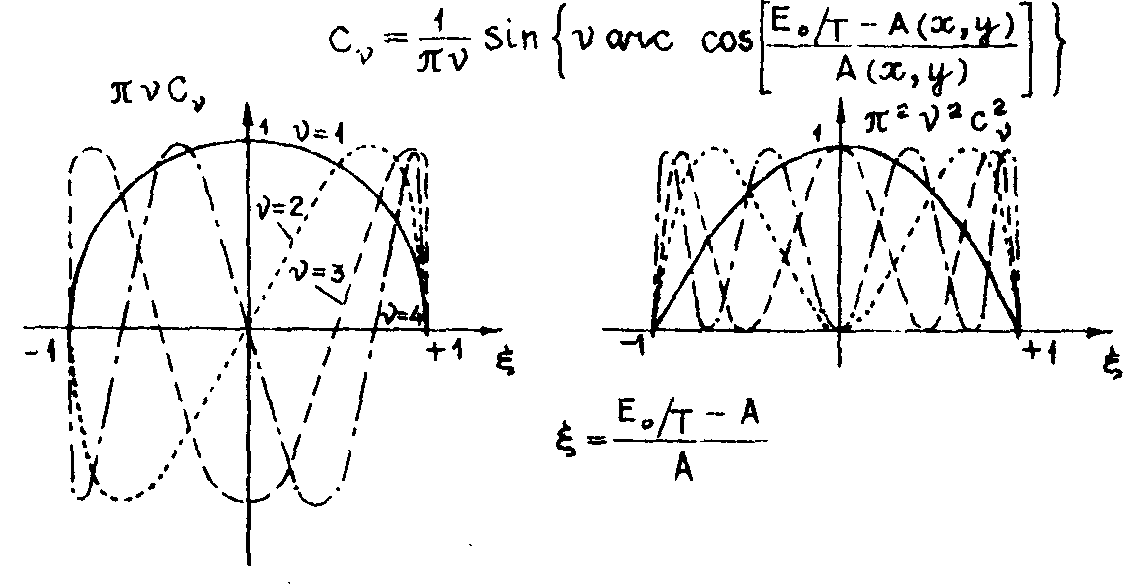
fig.7.
given in the dependence on the mean intensity a(x,y); the switch-exposure e0 and exposure time t. for the sake of simplicity the visibility is put one. below c
ν is plotted against ξ.
c
ν is determined by the chebychev polynomials of the second kind. the amplitude tν has zeroes and phase changes π for ν>1
. two kinds of experiments can be performed. the intensity is proportional to the squared polynomials and therefore no phase changes are to be considered in this case.
1.intensity experiment:
in transmitted light the transparency of two transparencies in
series is equal to the product of the transparencies. the whole procedure is demonstrated in fig.8.
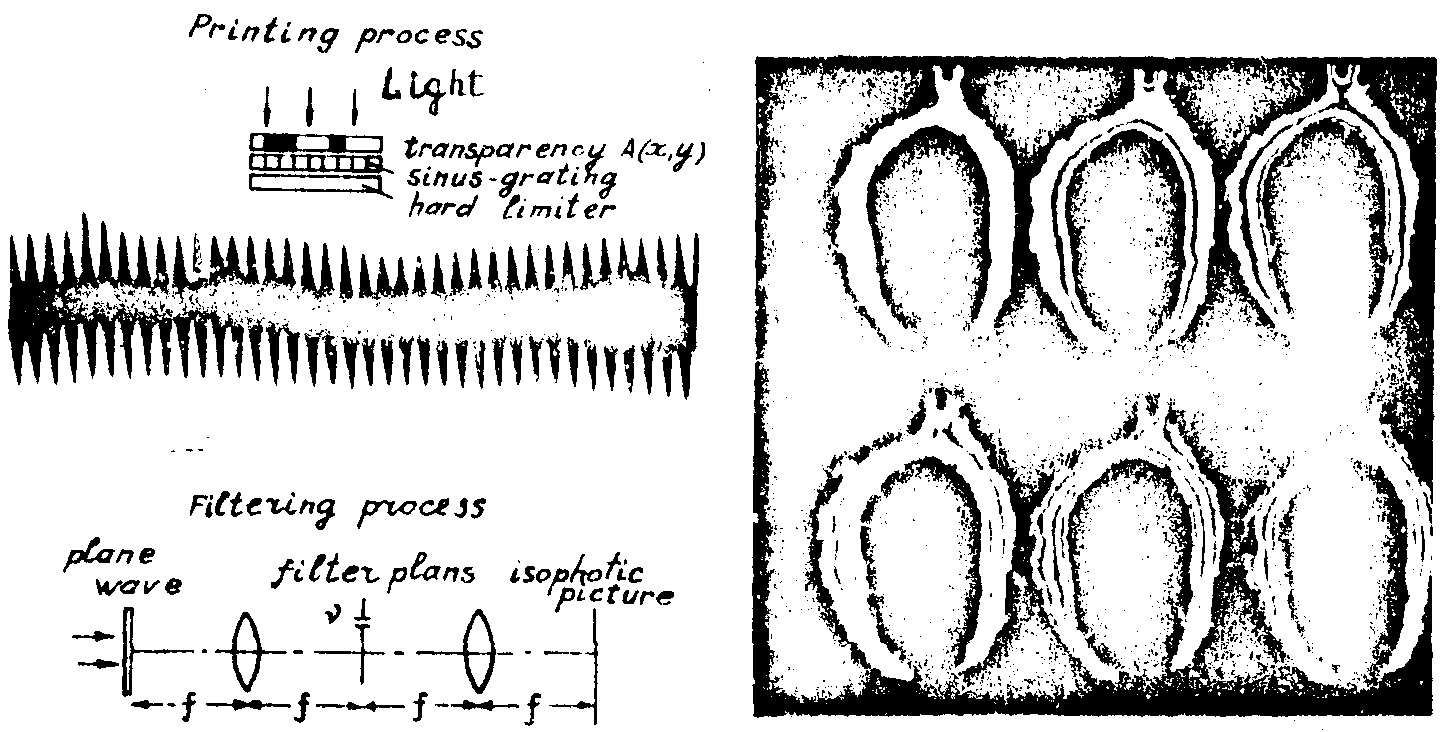
fig.8. fig.9.
first the printing process:
the light illuminates the combination a(x,y), sinusoidal grating and hard limiter. an example of such a modulated transparency can be seen here. after the development the hard print is put into the filtering apparatus. a window in the position of c
ν allows the light of the ν-th order to pass through it causing an isophotic picture of a(x,y) as can be seen in fig.9, where the outside part of a carton arc had been subject in the filtering process. the number of the diffraction orders is increasing from ν
=1 to ν=6. the number of zeroes is increased by one from order to order. the isophotes are calibrated one by another according to the chebychev polynomials /4/.
2. amplitude experiment.
the fourier coefficients c
ν are partly negative or in other words the phase of the light amplitudes has the value 0 and π
. these phase changes can be detected through an interference experiment by superimposing a reference wave.
the reference wave is generated by a grating put in contact with the modulated transparency (see fig.10). the grating may
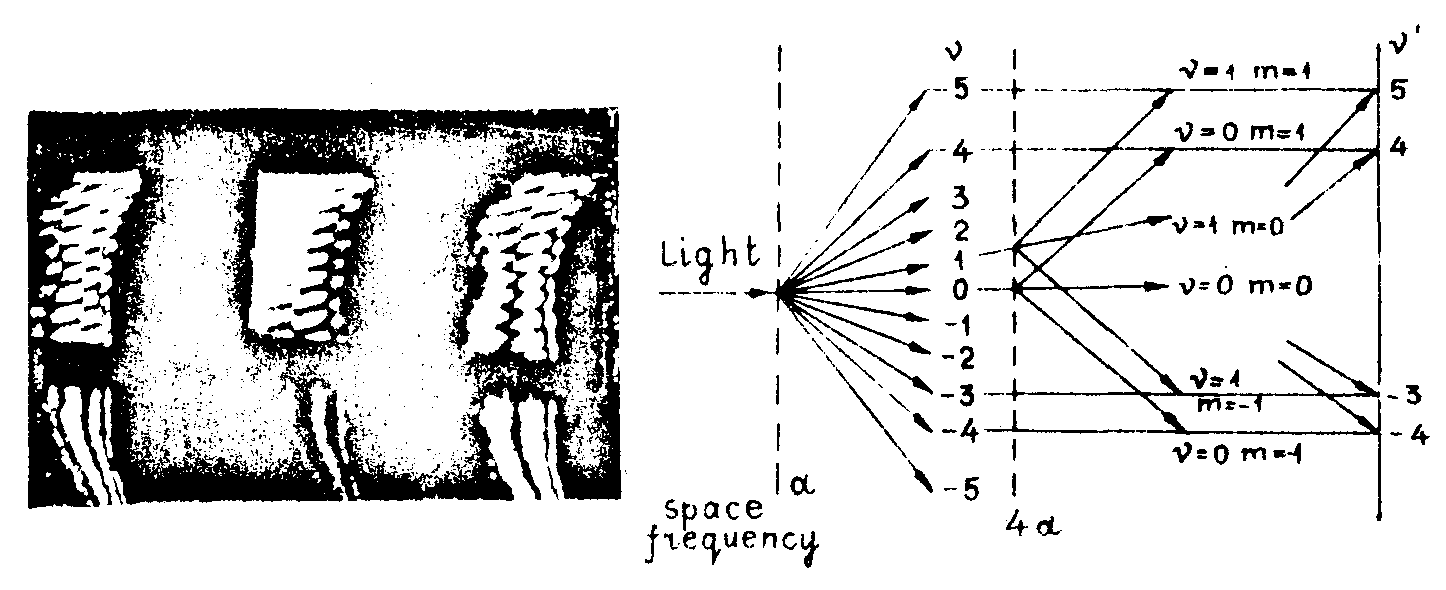
fig.10.
have a basic frequency of nearly
4α. then the zero order of the modulated object is diffracted in the direction of the ± fourth order of the object. also the first object orders are free from phase changes. therefore they can be used as reference waves for the fifth and the minus third object order. below three examples are given with ν=5,4,-3. the interference pattern indicates the phase changes.
references
1. l.j.cutrona et al. ire trans. on inf. theory, 5, 6, 386, 1960.
2. o.bryngdahl. josa, 59, 142, 1969.
3. j.schwider. optica acta, 15, 351, 1968.
4. j.schwider, r.burow. josa, 60, 1421, 1970.

